Influence of Salt Content on Soil Microbial Biomass Carbon
, , ,
1. Department of Resources and Environment, Binzhou University, Binzhou 256600, China; 2. Shandong Provincial Key Laboratory of Eco-Environmental Science for Yellow River Delta, Binzhou University, Binzhou 256600, China
1 Introduction
At present, the land of Yellow River Delta suffers different levels of salinization, and the area of land above mild salinization takes up about 50% of the total area. The soil microbial biomass carbon (SMBC) can reflect adaptation degree of soil microbes to salt and activity of microbes. Thus, the SMBC can measure the growth of crops in salinized soil to a certain extent. By now, researches focus on area survey and modified use of salinized soil, but there are few studies about biological and chemical process of salinized soil. Thus, studying the influence of the salt content on the SMBC can provide guidance for crop planting in different degree of salinization soil. This will be of great theoretical guidance significance for increasing ecosystem diversity, increasing soil fertility, and improving vegetation growth in the Yellow River Delta.
2 Materials and methods
2.1SoilsampleSoil samples were collected in cotton planting area in Guojiazhuang Village, Xiaobotou Town, Wudi County, Binzhou City, Shandong Province, and the soil parent material is coastal fluvo-aquic soil. We collected samples of low salt topsoil (0-20 cm), removed animal and plant residues, sieved, and measured the SMBC. Besides, we took part of soil samples for naturally drying and then measured the soil salt content. We separately took few soil samples for naturally drying, then sieved for measuring the soil organic matters (SOM). Basic physical and chemical properties of soil samples were: organic matters 17.67 g/kg, total nitrogen 1.07 g/kg, and soluble salt 0.10% and pH 7.58.
2.2Experimentalmethods
2.2.1Soil salt treatment. We set 4 salt gradients: (i) CK, soil salt content was 0.1% (S1); (ii) soil salt content was 0.5% (S2); (iii) soil salt content was 0.9% (S3); (iv) soil salt content was 1.3% (S4). The detailed operation was as follows: we weighed 4 pieces of 12.80 kg fresh soil samples and measured the soil moisture. According to dried samples, we calculated NaCl for 0.5% and 0.9%, dissolved the NaCl in 170 mL distilled water, evenly sprayed to each soil sample. For the control group, we adopted similar method to spray 170 mL distilled water, and cultured 14 days at 25℃ in dark condition.
Table1Basicphysicalandchemicalpropertiesofsoilafterpreliminaryculturefor14dayswithsalt

SoilsaltSMBC∥mg/kgpHEC∥μs/cmS1161.6±0.37.59±0.10102±8S2168.7±3.37.66±0.12446±15S3163.3±0.47.61±0.10847±18S4125.8±5.37.61±0.101179±21
2.2.2Substrate treatment. We carried out 4 treatments of substrate addition: (i) CK, no addition of substrate; (ii) addition of nitrogen source (N); (iii) addition of carbon source (C); (iv) addition of carbon + nitrogen source (C+N). We took ammonium chloride (NH4Cl) and glucose as nitrogen source and carbon source, added 30 mg/kg N and 750 mg/kg C separately. Detailed operation was as follows: we took 3 salt soil samples cultured according to the above procedure, divided each sample into 4 equal parts and added different substrates. According to different substrate treatment, we weighed glucose and NH4Cl, dissolved each treatment of substrate into 50 mL distilled water, evenly sprayed onto the soil sample, to make the soil moisture reach 60% WHC.
2.2.3Sampling. We weighed 150.00g treated soil sample and put it into 1 L wide neck flask, sealed with wrapping film, pricked several pores on the film for ventilation, and cultured the soil sample at 25℃ in dark condition for 45 days. Each treatment repeated 3 times and a total of 288 wide neck flasks were used. During culture, we regularly weighed each wide neck flask to compensate water loss, and took destructively sampling and measured the SMBC content in 0, 2nd, 5th, 10th, 20th, 30th, and 45th day.
2.3Preparationofreagents
2.3.1Preparation of ethanol-free chloroform. We prepared ethanol-free chloroform according to standard, put the purified chloroform in dark reagent bottle, and kept it at low temperature (4℃) in dark condition.
2.3.2Potassium sulfate (K2SO4) extraction agent. We prepared potassium sulfate (K2SO4) extraction agent according to standard.
2.3.3Liquid TOC standard solution. We used high concentration stock solution (500 mg/L TIC+500 mg/L TOC + 500 ppm TNb), and volumetric flask 1000 mL (glass flask). We accurately weighed 4412.1 mg sodium carbonate (Na2CO3), 1062.7 mg potassium hydrogen phthalate (KHP), 1178.54 mg ammonium sulfate[(NH4)2SO4], 1804.55 mg potassium nitrate (KNO3), dissolved with de-ionized water and diluted to 1000 mL, and then diluted the above standard solution to 5 ppm for use.
2.4InstrumentsanddevicesWe used total organic carbon analyzer (liquiTOCII, German).
2.5Analyticalmethods
2.5.1Measurement of the SMBC. (i) Fumigation. We weighed 3 samples of fresh soil equivalent to 20.0 g dried soil and put into 80 mL beaker. Next, we put the beaker into vacuum drier, and placed 2-3 beakers containing ethanol-free chloroform (about 2/3 beaker), and placed a small glass of diluted NaOH solution to absorb CO2released during fumigation. We used fumigation vacuum pumping device to pump vacuum, made chloroform violently boil for 3-5 minutes at -0.07 MPa, and fumigated for 24 hours at 25℃ in dark condition. We took out soil and chloroform, put the beaker with soil into the vacuum drier, and pumped vacuum repeatedly (-0.07MPa) till no chloroform smell in soil. At the same time, we separately weighed 3 soil samples with equal weight, placed into another drier, omitted the fumigation process, and took this as control group soil. (ii) Extraction. We un-destructively moved the fumigated soil into 200 mL polyethylene plastic bottle, added 100 mL 0.5 mol/L K2SO4, the ratio of soil to water was 1:4 (w:v), conducted oscillation (25℃, 300 r/min) extraction for 30 minutes, and filtered with mid-speed quantitative filter paper to 125 mL plastic bottle. In the meantime, we separately weighed 3 samples un-fumigated soil and put them into 200 mL polyethylene plastic bottle, and added 100 mL 0.5 mol/L K2SO4for extraction. Besides, we took 3 reagents containing no soil as blank reagents. (iii) Measurement. Working curve: we separately absorbed 5 ppm standard solution into 6 sample bottles, and plotted the standard curves according to different volume sampling methods for the same sample. Sample measurement: we absorbed 1 mL soil extraction solution into 40 mL sample bottle, and added 9 mL ultrapure water. We used total organic carbon analyzer (LiquiTOC II) to measure organic carbon content in sample solution. (iv) Result calculation. The SMBC: BC = EC / kEC, where EC = organic carbon extracted from fumigated soil-organic carbon extracted from un-fumigated soil; kEC is conversion coefficient (0.45 in this study) (Wuetal., 1990)
2.5.2Measurement of other indicators. The soil organic matter (SOM) was measured using the potassium dichromate heating method. Total nitrogen (TN) was determined by dry combustion method and measured by element analyzer (varioEL III, German). Soil salt content was measured by mass method.
2.6DataanalysisWe employed Excel2003 and SPSS12.0 software to make plotting and data statistical analysis.
3 Results and analyses
3.1DynamicchangesintheSMBCtreatedbydifferentsubstrates
3.1.1No substrate treatment. From Fig. 1, it can be seen that the SMBC has increase trend on the whole. From the culture, the SMBC of each treatment rapidly declined. In the second day after culture, the SMBC of each treatment reached the minimum value, dropped about 4.8%, 5.3%, 4.4% and 5.9% respectively compared with the original value.
Rapid decline of the SMBC was because microbes needed to continue adapting to the growth environment and salt content inhibited activity of soil microbes. Later, it started to rise rapidly. From the second day to the fifth day, the growth rate was the highest, and the growth rate was 42.0%, 79.0%, 50.0% and 226.0% respectively. Rapid rise of the SMBC in this period was largely because nutrients were relatively rich, activity of microbes started to increase, and newly added organic carbon was rapidly converted into the SMBC[12]. From the 10th day to the 20th day, the SMBC was basically balanced. From the 20th day, the SMBC of each treatment started declining and in the 30th day, it reached the minimum value, 173.97 mg/kg, 119.03 mg/kg, 118.60 mg/kg, and 104.01 mg/kg respectively. Except S1, all were below the initial value. From the 30th day, the SMBC of each treatment started increasing, but the growth rate was obviously lower than that from the second day to the 5th day. At the end of culture, the SMBC was 222.15 mg/kg, 256.86 mg/kg, 225.41 mg/kg, and 196.82 mg/kg. Compared with the initial SMBC, the growth rate was 38.0%, 52.0%, 38.0%, and 56.0% respectively.
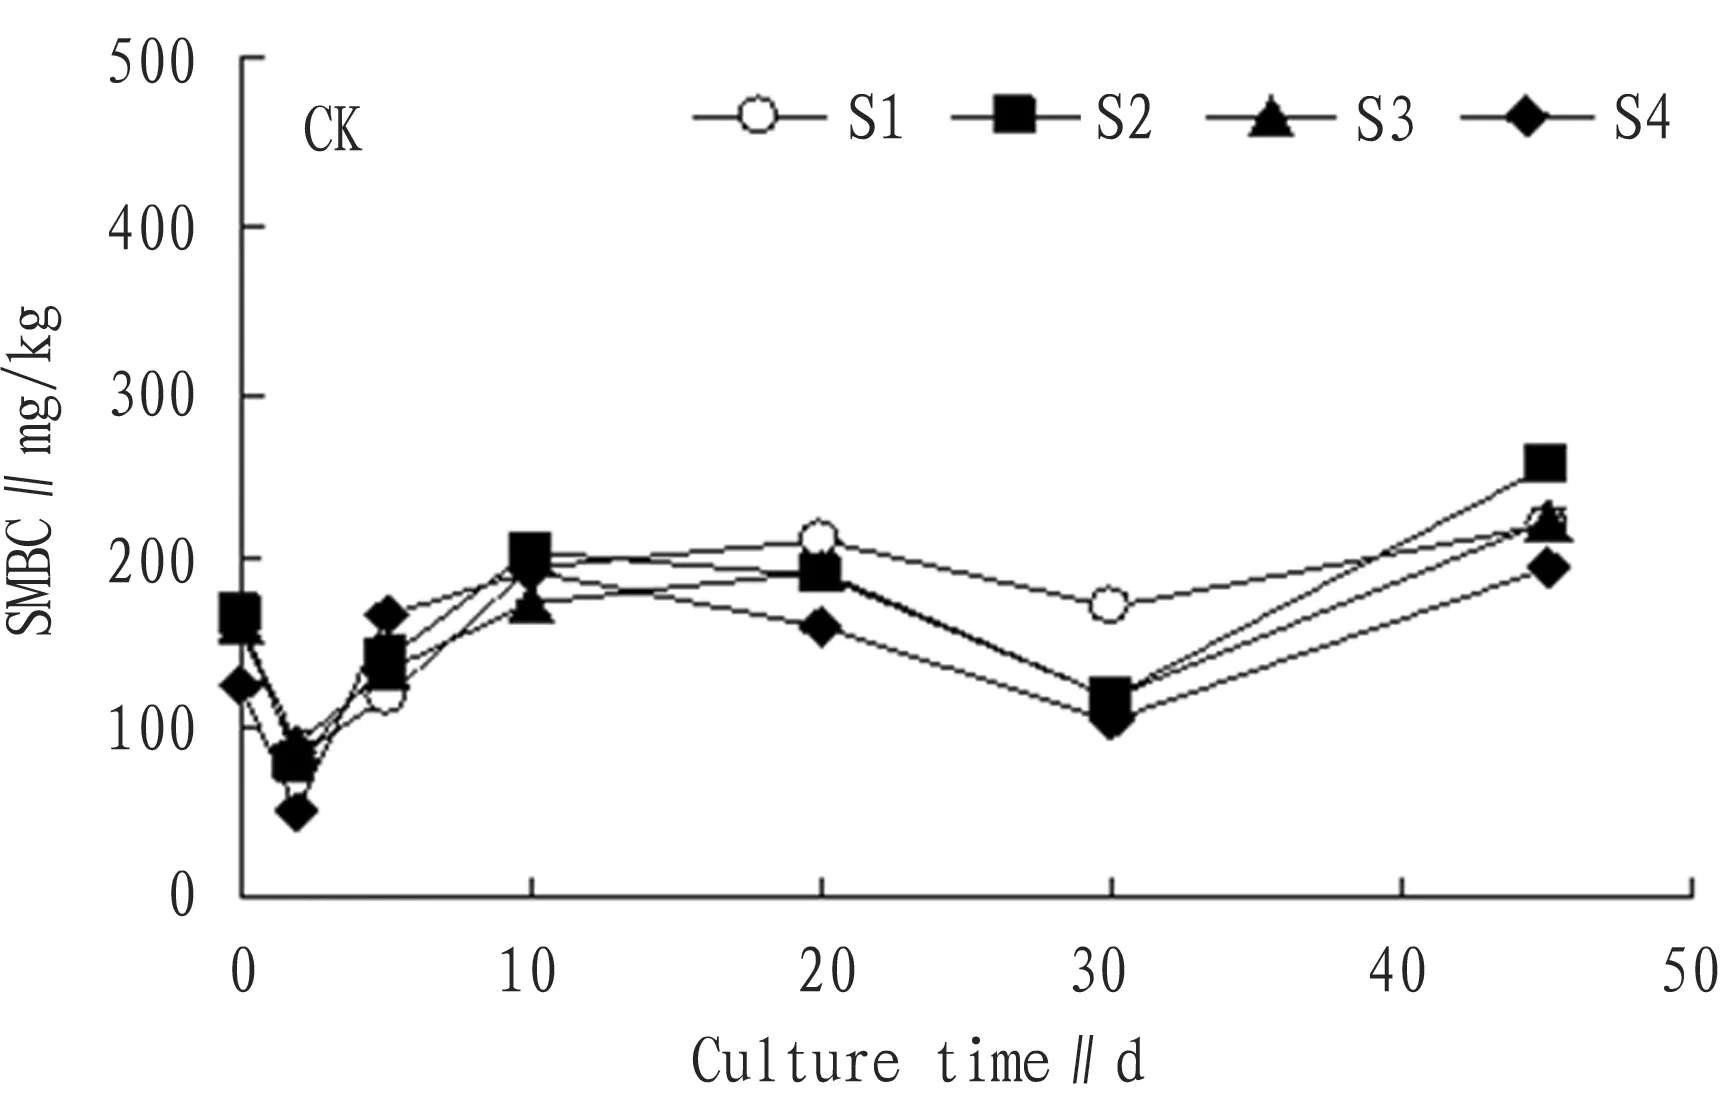
Fig.1ChangesintheSMBCwithoutadditionofsubstratewithtime
3.1.2Addition of nitrogen source. From Fig. 2, we can see that the SMBC after addition of nitrogen source remained fluctuation, the overall changes were balanced compared with the initial value. In other words, nitrogen treatment exerted little influence on the SMBC.
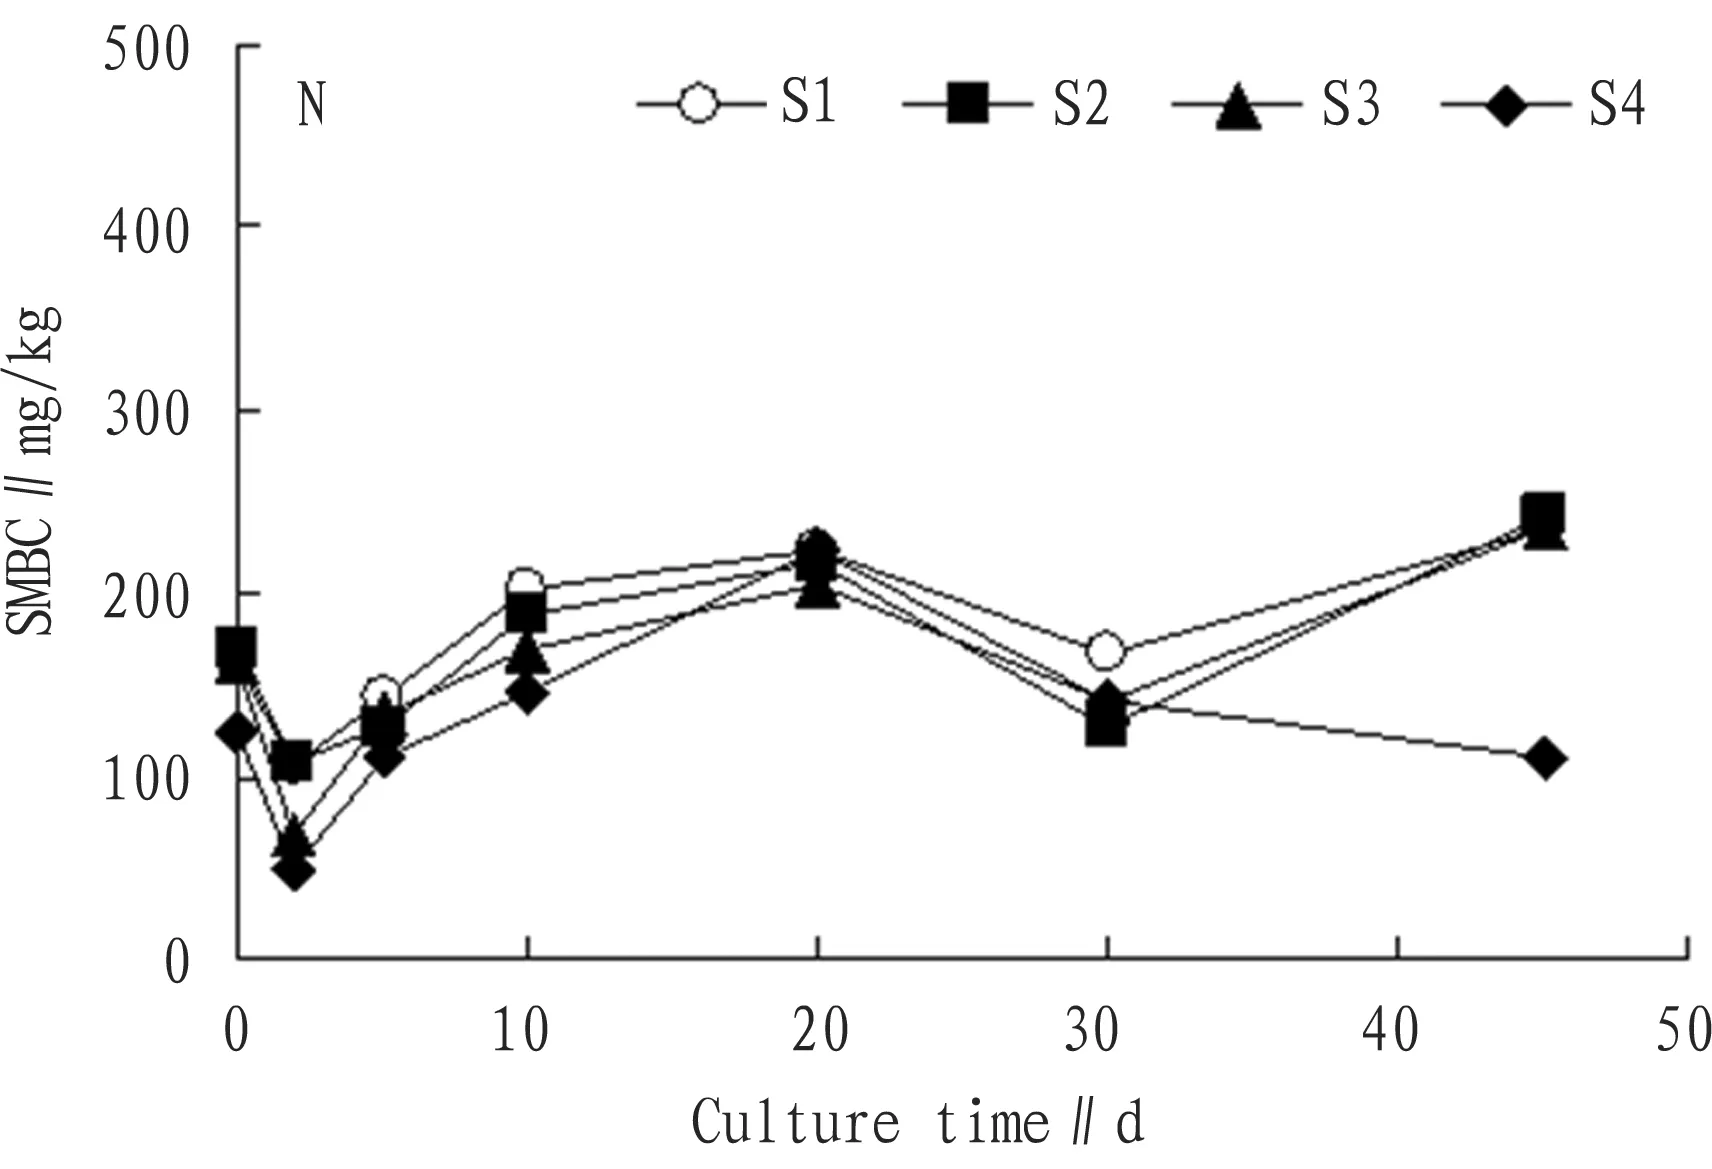
Fig.2ChangesintheSMBCwithadditionofnitrogensourcewithtime
In the 2nd of culture, the SMBC was 06.89 mg/kg, 107.40 mg/kg, 69.48 mg/kg, and 48.62 mg/kg respectively, which were 34.0%, 36.0%, 57.0% and 61.0% respectively lower than the original value. After addition of nitrogen source, C/N ratio was too low, not favorable for growth of microbes, and microbes needed to adapt to changed environment, thus their activity would decline, and the SMBC accordingly declined[13]. From the 5th day to the 45th day, the SMBC remained in dynamic balance. In the 45th day of culture, the SMBC grew by 46.3%, 44.3%, 44.4%, and 12.2% compared with initial value.
3.1.3Addition of carbon source. From Fig. 3, we can see that after addition of glucose (C), nutrients necessary for growth of microbes were abundant, activity of microbes was high, and the speed of exotic organic carbon converted to microbial biomass carbon was high. After addition of carbon source, although the growth rate was different in each period, the SMBC measured in each time point was higher than the initial value, while the SMBC of S1 and S2 salt treatment was obviously higher than that of S3 and S4 treatment. In the 45th day, the SMBC of each treatment was 357.17 mg/kg, 367.84 mg/kg, 357.58 mg/kg, and 210.37 mg/kg. Compared with the initial SMBC, the growth rate was 121.0%, 118.0%, 119.0%, and 67.0% respectively. Obviously, the SMBC at this time was much higher than the initial SMBC.
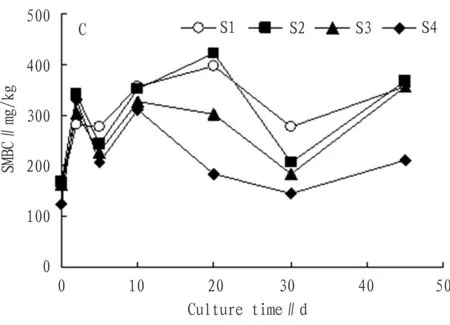
Fig.3ChangesintheSMBCwithadditionofcarbonsourcewithtime
3.1.4Addition of nitrogen + carbon source. From Fig. 4, we can see that addition of nitrogen + carbon source significantly increased the SMBC, and the SMBC took on significant increase trend on the whole.
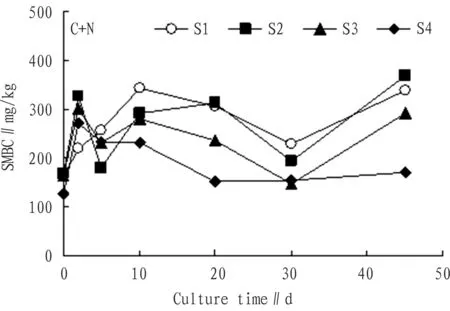
Fig.4ChangesintheSMBCwithadditionofcarbon+nitrogensourcewithtime
From the 2nd to the 5th day, the decline of SMBC was possibly because C source was consumed too rapidly in the first two days, it was converted to the SMBC, making C/N ratio decline, and the nitrogen content was relatively high, which restricts activity of soil microbes and decomposition rate of microbes also decline[15]. In the 10th day, compared with the initial SMBC, the growth rate of SMBC was 113.0%, 73.0%, 71.0%, and 83.0% respectively. In the 20th day, compared with the initial SMBC, the growth rate of SMBC was 90.0%, 86.0%, 45.0%, and 21.0% respectively. In the 30th day, compared with the initial SMBC, the growth rate of SMBC was 41.0%, 4.0%, -9.0%, and 22.0% respectively. Except negative growth in the 30th day, the SMBC was higher than initial SMBC in other times. In the 45th day, the SMBC had slight increase, and compared with the initial SMBC, the growth rate was 109.0%, 119.0%, 79.0%, and 36.0% respectively. In sum, addition of carbon + nitrogen source significantly increased the SMBC.
3.2ChangesinaverageSMBCintheentirecultureperiodaftertreatmentofdifferentsubstrates
3.2.1No addition of substrate. According to Fig. 5, with the rise in the soil salt content, the SMBC declined accordingly. In other words, increase in the salt content brought about decline of SMBC. However, when the salt content was 0.1% and 0.5%, there was no big difference in the SMBC. From analysis, we could reach following conclusion: except insignificant difference in the SMBC between S1 and S2, the difference between any other two was significant.
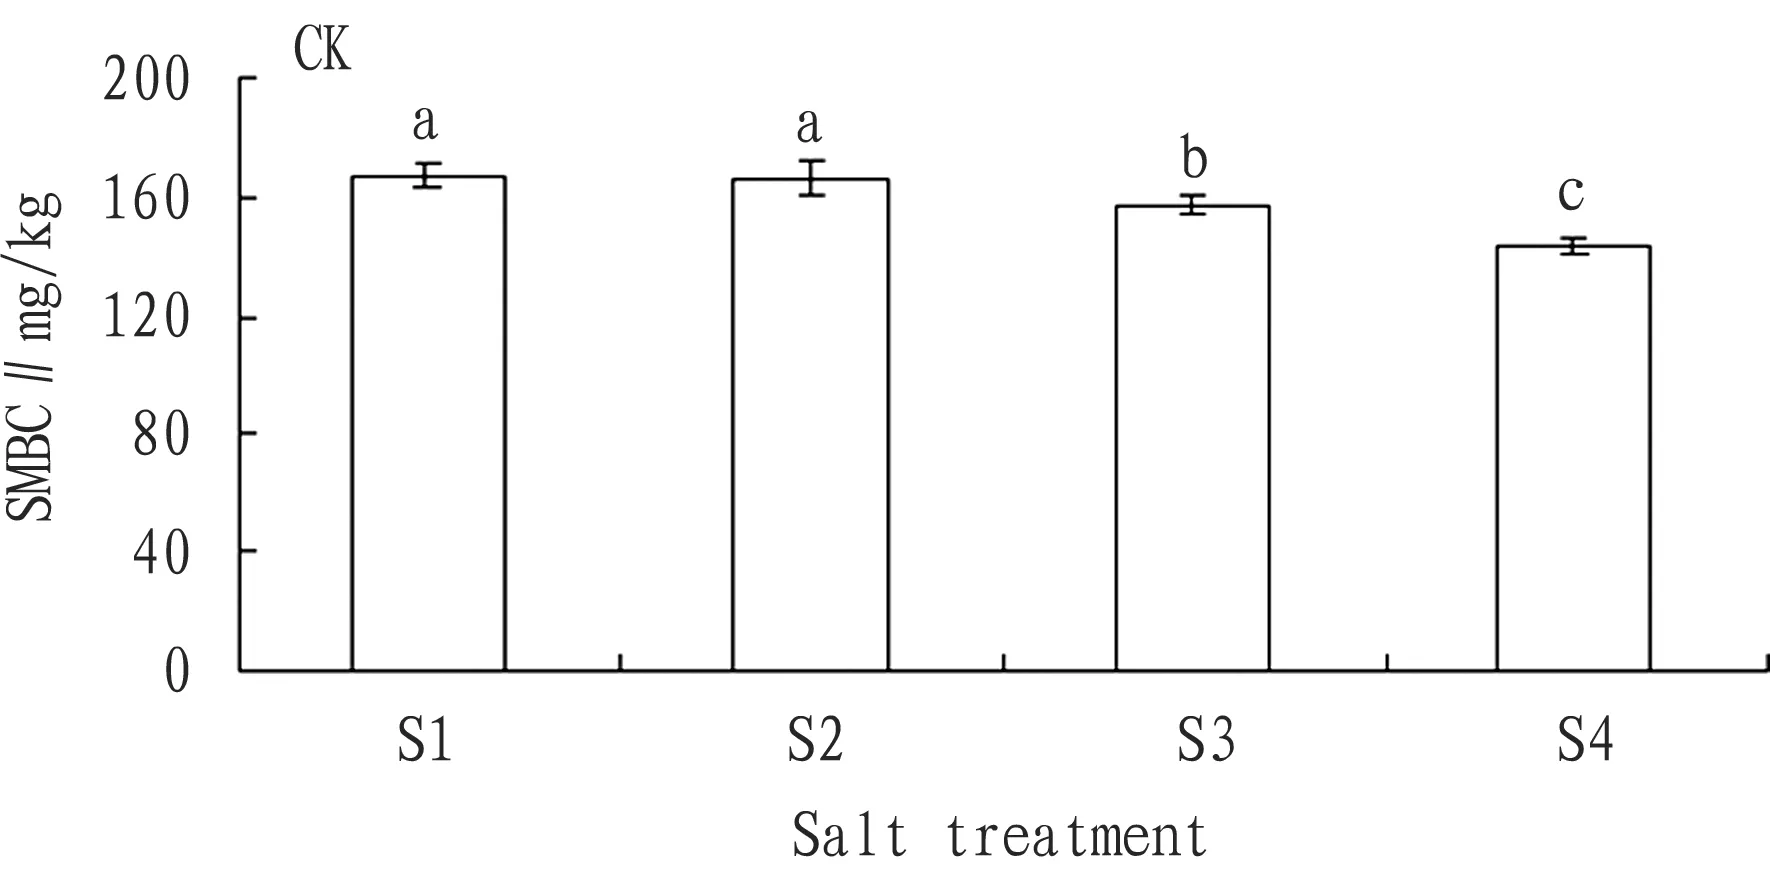
Fig.5ChangesintheaverageSMBCofeachsalttreatmentwithnoadditionofsubstrate
3.2.2Addition of nitrogen source. According to Fig. 6, with the rise in the soil salt content, the SMBC had the decline trend Compared with the SMBC of S1 salt treatment, the SMBC of S2, S3, and S4 treatments declined by 4.6%, 9.0%, and 24.0% respectively. Compared with the SMBC of S1, the SMBC of S2, S3, and S4 significantly declined. From analysis, except no obvious difference between S2 and S3, the difference between any other two was significant.
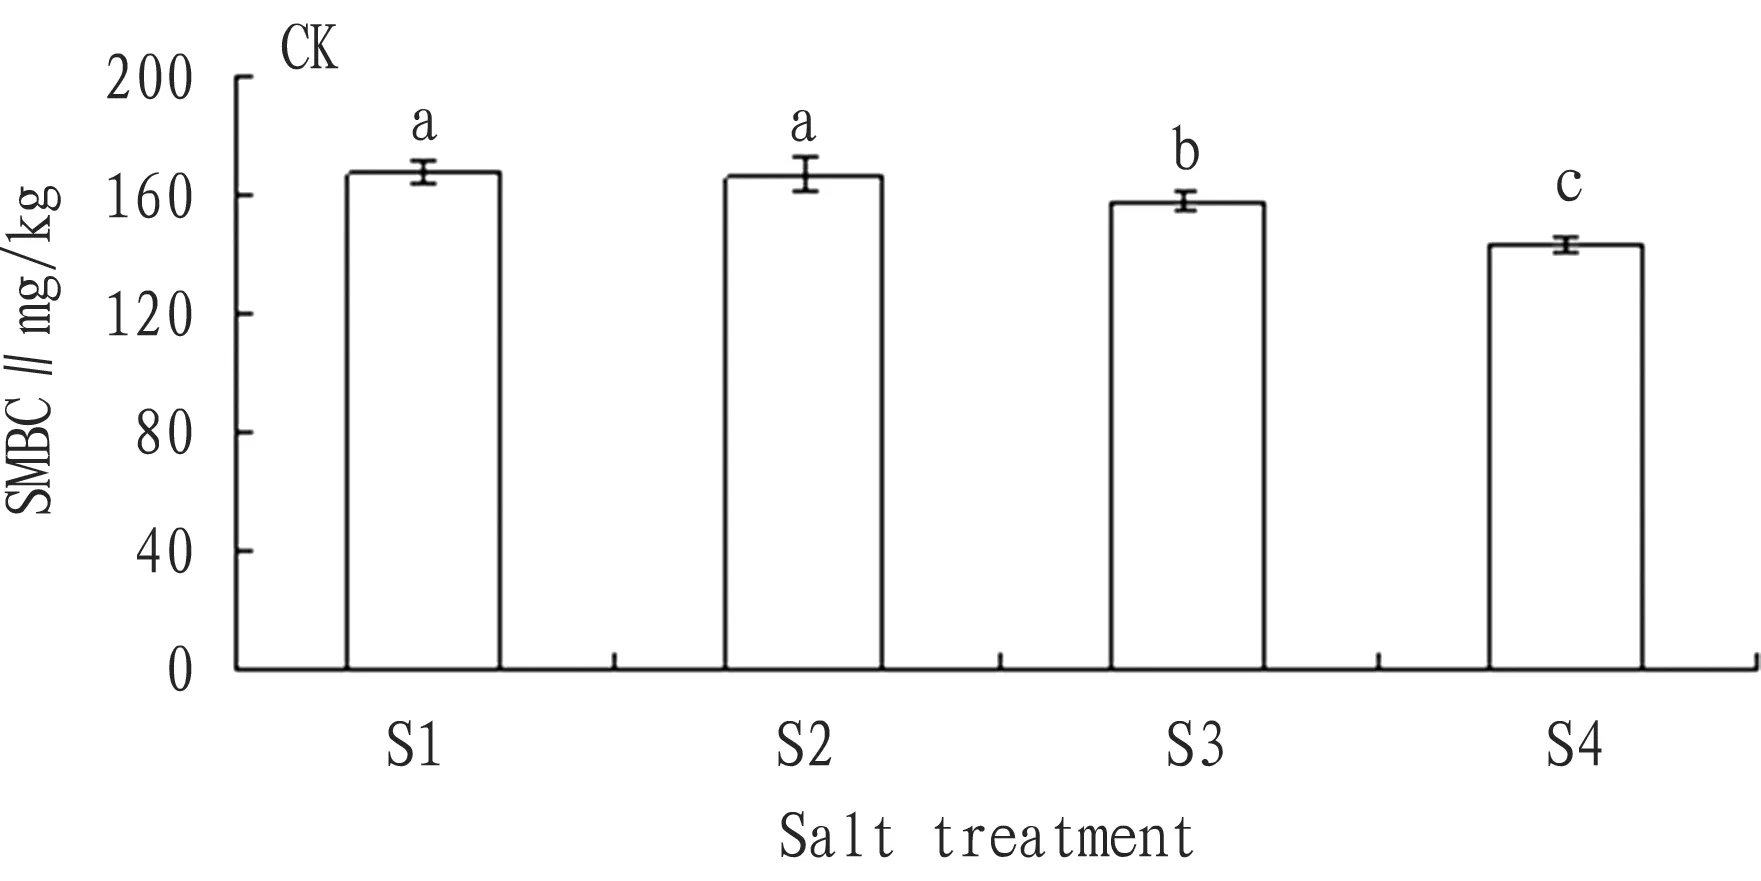
Fig.6ChangesintheaverageSMBCofeachsalttreatmentwithadditionofnitrogensource
3.2.3Addition of carbon source. According to Fig. 7, with the rise of soil salt content, the SMBC significantly declined. Compared with the SMBC of S1 treatment, the SMBC of S2, S3, and S4 treatments declined by 0.3%, 11.5%, and 28.0% respectively. Compared with the SMBC of S1 treatment, the decline in SMBC of S2 treatment was not obvious, while that of S3 and S4 treatments was significant. From analysis, we could reach following conclusion: except insignificant difference in the SMBC between S1 and S2, the difference between any other two was significant.
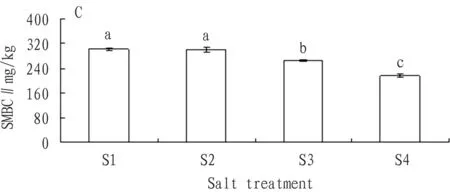
Fig.7ChangesintheaverageSMBCofeachsalttreatmentwithadditionofcarbonsource
3.2.4Addition of nitrogen + carbon source. According to Fig. 8, with the rise of the soil salt content, the SMBC declined accordingly. Compared with the SMBC of S1 treatment, the SMBC of S2, S3, and S4 treatments declined 10.49 mg/kg, 57.94 mg/kg and 116.47 mg/kg, and the decline rate was 3.5%, 19.5% and 39.5% respectively. From analysis, except no obvious difference between S1 and S2, the difference between any other two was significant.
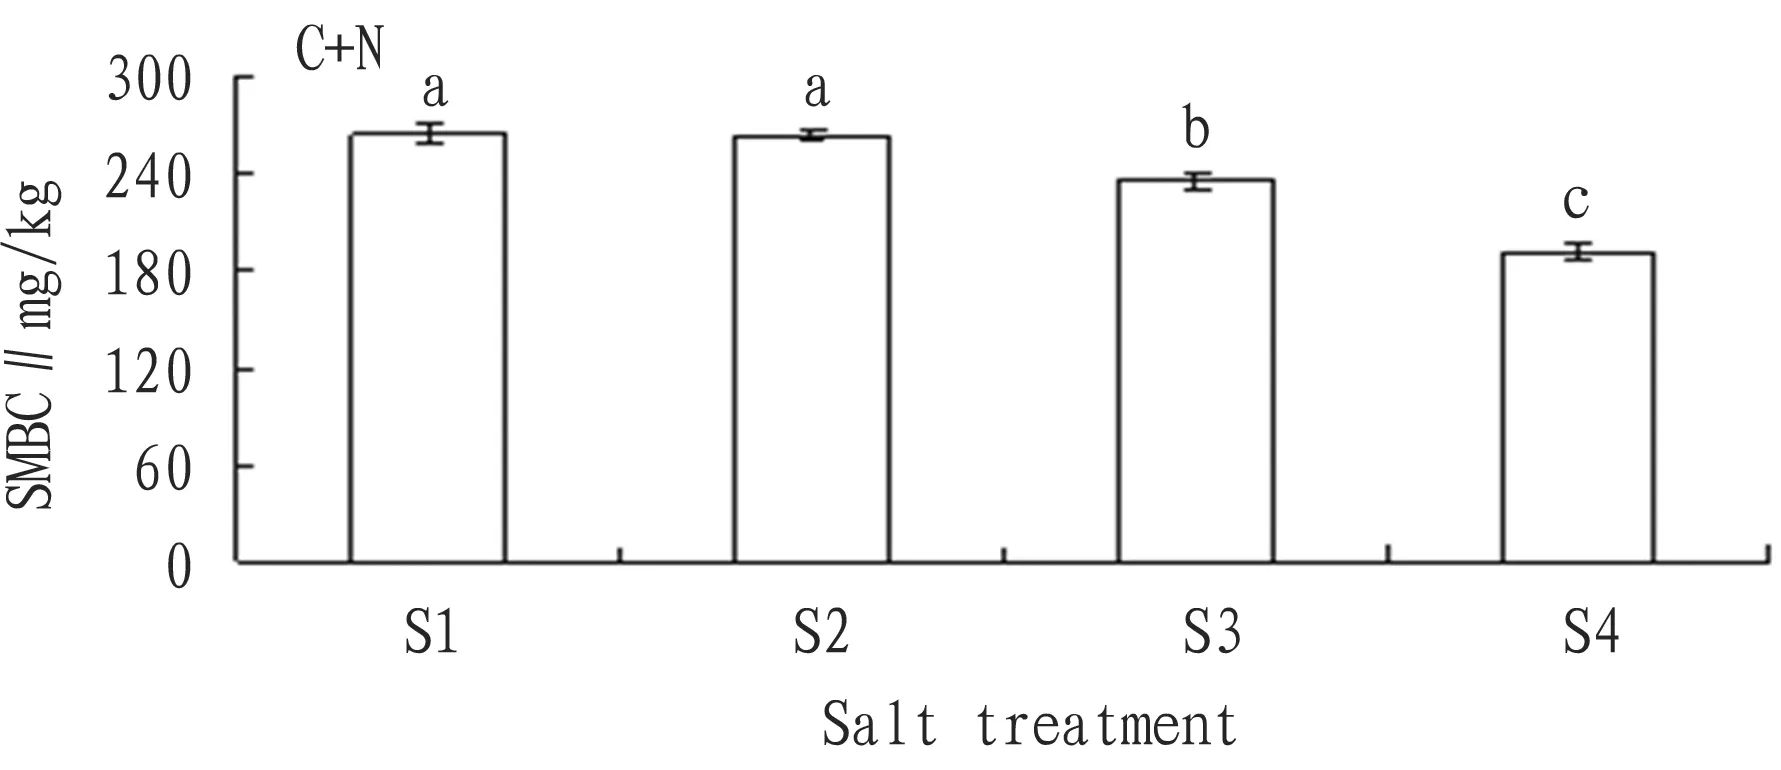
Fig.8ChangesintheaverageSMBCofeachsalttreatmentwithadditionofcarbon+nitrogensource
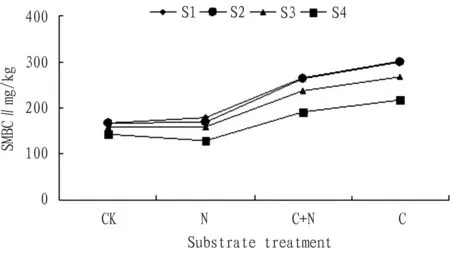
Fig.9ComparisonoftheSMBCindifferentsubstratetreatmentsatthesamesaltgradient
3.3ComparisonoftheSMBCindifferentsubstratetreatmentsatthesamesaltgradientAccording to Fig. 9, the influence of substrate treatment on the SMBC was C>C+N>N. When carbon source was added to the soil, compared with the control group, the growth rate of the SMBC of four salt treatments was 81.0%, 80.0%, 69.0%, and 52.0% respectively. When carbon + nitrogen source was added to the soil, compared with the control group, the growth rate of the SMBC of four salt treatments was 59.0%, 58.0%, 50.0%, and 34.0% respectively. When nitrogen source was added to the soil, compared with the control group, the growth rate of the SMBC of four salt treatments was 7.0%, 1.0%, 1.0%, and -1.0% respectively. Therefore, the growth degree of the SMBC with addition of carbon source was higher than that with addition of carbon + nitrogen source. The influence of addition of nitrogen source on the SMBC was not significant. With increase in the salt concentration, the growth rate of the SMBC of four substrate treatments declined accordingly.
4 Conclusions
(i) After addition of different substrates, the SMBC in high salt content (S3 and S4) is obviously lower than that in low salt content (S1 and S2). The decline rate of S3 and S4 is 5.4% and 14.2% for no addition of substrate; the decline rate is 9.0% and 24.0% for addition of nitrogen source; the decline rate is 11.5% and 28.0% for addition of carbon source; the decline rate is 19.5% and 39.5% for addition of carbon source + nitrogen source.
(ii) Compared with no addition of substrates, addition of nitrogen source could not increase the SMBC. Addition of carbon source and carbon + nitrogen can significantly increase the SMBC, and the increase in low salt content soil (80.0%-81.0% and 58.0%-59.0%) is obviously higher than high salt content soil (52.0%-69.0% and 34.0%-50.0%).
(iii) Generally, when the soil salt content is low (≤0.5%), the influence of different substrate treatment is little on the SMBC, and increasing the soil salt content can obviously reduce the SMBC.
[1] LIU YC, HE WS, HE JZ,etal. Progress of improvement and utilization of saline-alkali land[J]. Journal of Agricultural Sciences, 2007, 28(2): 68-71.(in Chinese).
[2] CHEN XJ, MA NY. On the restoration and improvement of saline-alkali soil ecosystem[J]. Science & Technology Information, 2010, 5(10): 119-121.(in Chinese).
[3] YU YY, ZHAO BZ. Effect of amendment of inorganic nitrogen and glucose on soil microbial biomass and activity[J]. Acta Pedologica Sinica, 2012, 49(1): 45-49.(in Chinese).
[4] HUANG H, CHEN GS, XIE JS. Advances on soil microbial biomass carbon and its effect factor[J]. Hubei Forestry Science and Technology, 2006, 38(3): 34-41. (in Chinese).
[5] COLEMAN DC, REID CPP , COLO C. Biological strategies of nutrient cycling in soil systems[J]. Advances in Ecological Research, 1983, 2(13): 1-55.
[6] LIU GP. Mending measures of the sea salting land of Telta of the Huanghe River[J]. Journal of Shandong Agricultural University, 2009,6(3): 68-69.(in Chinese).
[7] SPARLING GP. Ratio of microbial biomass carbon to soil organic carbon as a sensitive indicator of changes in soil organic matter[J]. Australian Journal of Soil Research, 1992(30): 195-207.
 Asian Agricultural Research2016年9期
- Asian Agricultural Research的其它文章
- Thoughts about Plant Landscape Forms of Urban Gardens
- Problems in Statistical Data of Agricultural Population in the United States in 1910-1970
- Modernized Development of Urban Farming Industry: A Case Study of Kunming City
- A Study of Grain Scale Management Mode in Hubei Province
- How to Build Artificial Grassland in the Cold and Semi-Arid Regions?—A Case Study in Naqu
- The Cotton Stalk and Its Utilization as Ruminant Feed Resource in Xinjiang
