
Qinghai: West Mining 100,000 t/a Zinc Project Started Production
2015-11-22 03:37:37
China Nonferrous Metals Monthly 2015年11期
?
Qinghai: West Mining 100,000 t/a Zinc Project Started Production
On September 30, the 100,000 t/a electricity zinc project of West Mining, a key project of Qinghai Province in the “Twelfth Five Year Plan”, formally started production, this project is the second in China and the first project in Western China that adopts world cutting-edge “oxygen pressure leaching whole wet method zinc smelting process” technology, which holds crucial significance for improving enterprise energy saving and emission reduction standard, and accelerating Qinghai Province’s transition progress to transform from resource advantage to economic advantage and development advantage. Tuo Yulin, member of the Standing Committee of CPC Provincial Committee and Executive Vice Governor, attended the ceremony.
Located in Xining Ganhe Industrial Park, West Mining’s 100,000 t/a electric oxygen pressure leaching new technology project is a key construction project of Qinghai Province in the “Twelfth Five Year Plan” period, and also a major project of the enterprise in its effort to extend industrial chain and optimize industrial deployment, the Project has a total investment of 1.37 billion yuan, and the designed annual output is 100,000 tonnes of zinc ingot. The project adopts world cutting-edge “oxygen pressure leaching whole wet method zinc smelting process”, which is a low pollution, and low emission advanced smelting technology, and plays positive promoting role for improving enterprise energy saving and emission reduction standard, and enhancing market competitiveness.
Unit: metric ton
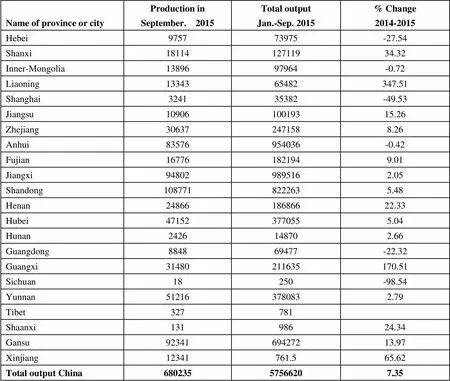
Name of province or cityProduction inSeptember. 2015Total outputJan.-Sep. 2015% Change2014-2015 Hebei975773975-27.54 Shanxi1811412711934.32 Inner-Mongolia1389697964-0.72 Liaoning1334365482347.51 Shanghai324135382-49.53 Jiangsu1090610019315.26 Zhejiang306372471588.26 Anhui83576954036-0.42 Fujian167761821949.01 Jiangxi948029895162.05 Shandong1087718222635.48 Henan2486618686622.33 Hubei471523770555.04 Hunan2426148702.66 Guangdong884869477-22.32 Guangxi31480211635170.51 Sichuan18250-98.54 Yunnan512163780832.79 Tibet327781 Shaanxi13198624.34 Gansu9234169427213.97 Xinjiang12341761.565.62 Total output China68023557566207.35
Unit: metric ton
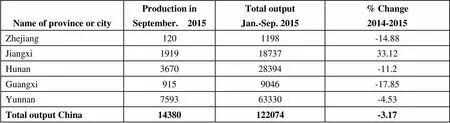
Name of province or cityProduction inSeptember. 2015Total outputJan.-Sep. 2015% Change2014-2015 Zhejiang1201198-14.88 Jiangxi19191873733.12 Hunan367028394-11.2 Guangxi9159046-17.85 Yunnan759363330-4.53 Total output China14380122074-3.17
Unit: metric ton
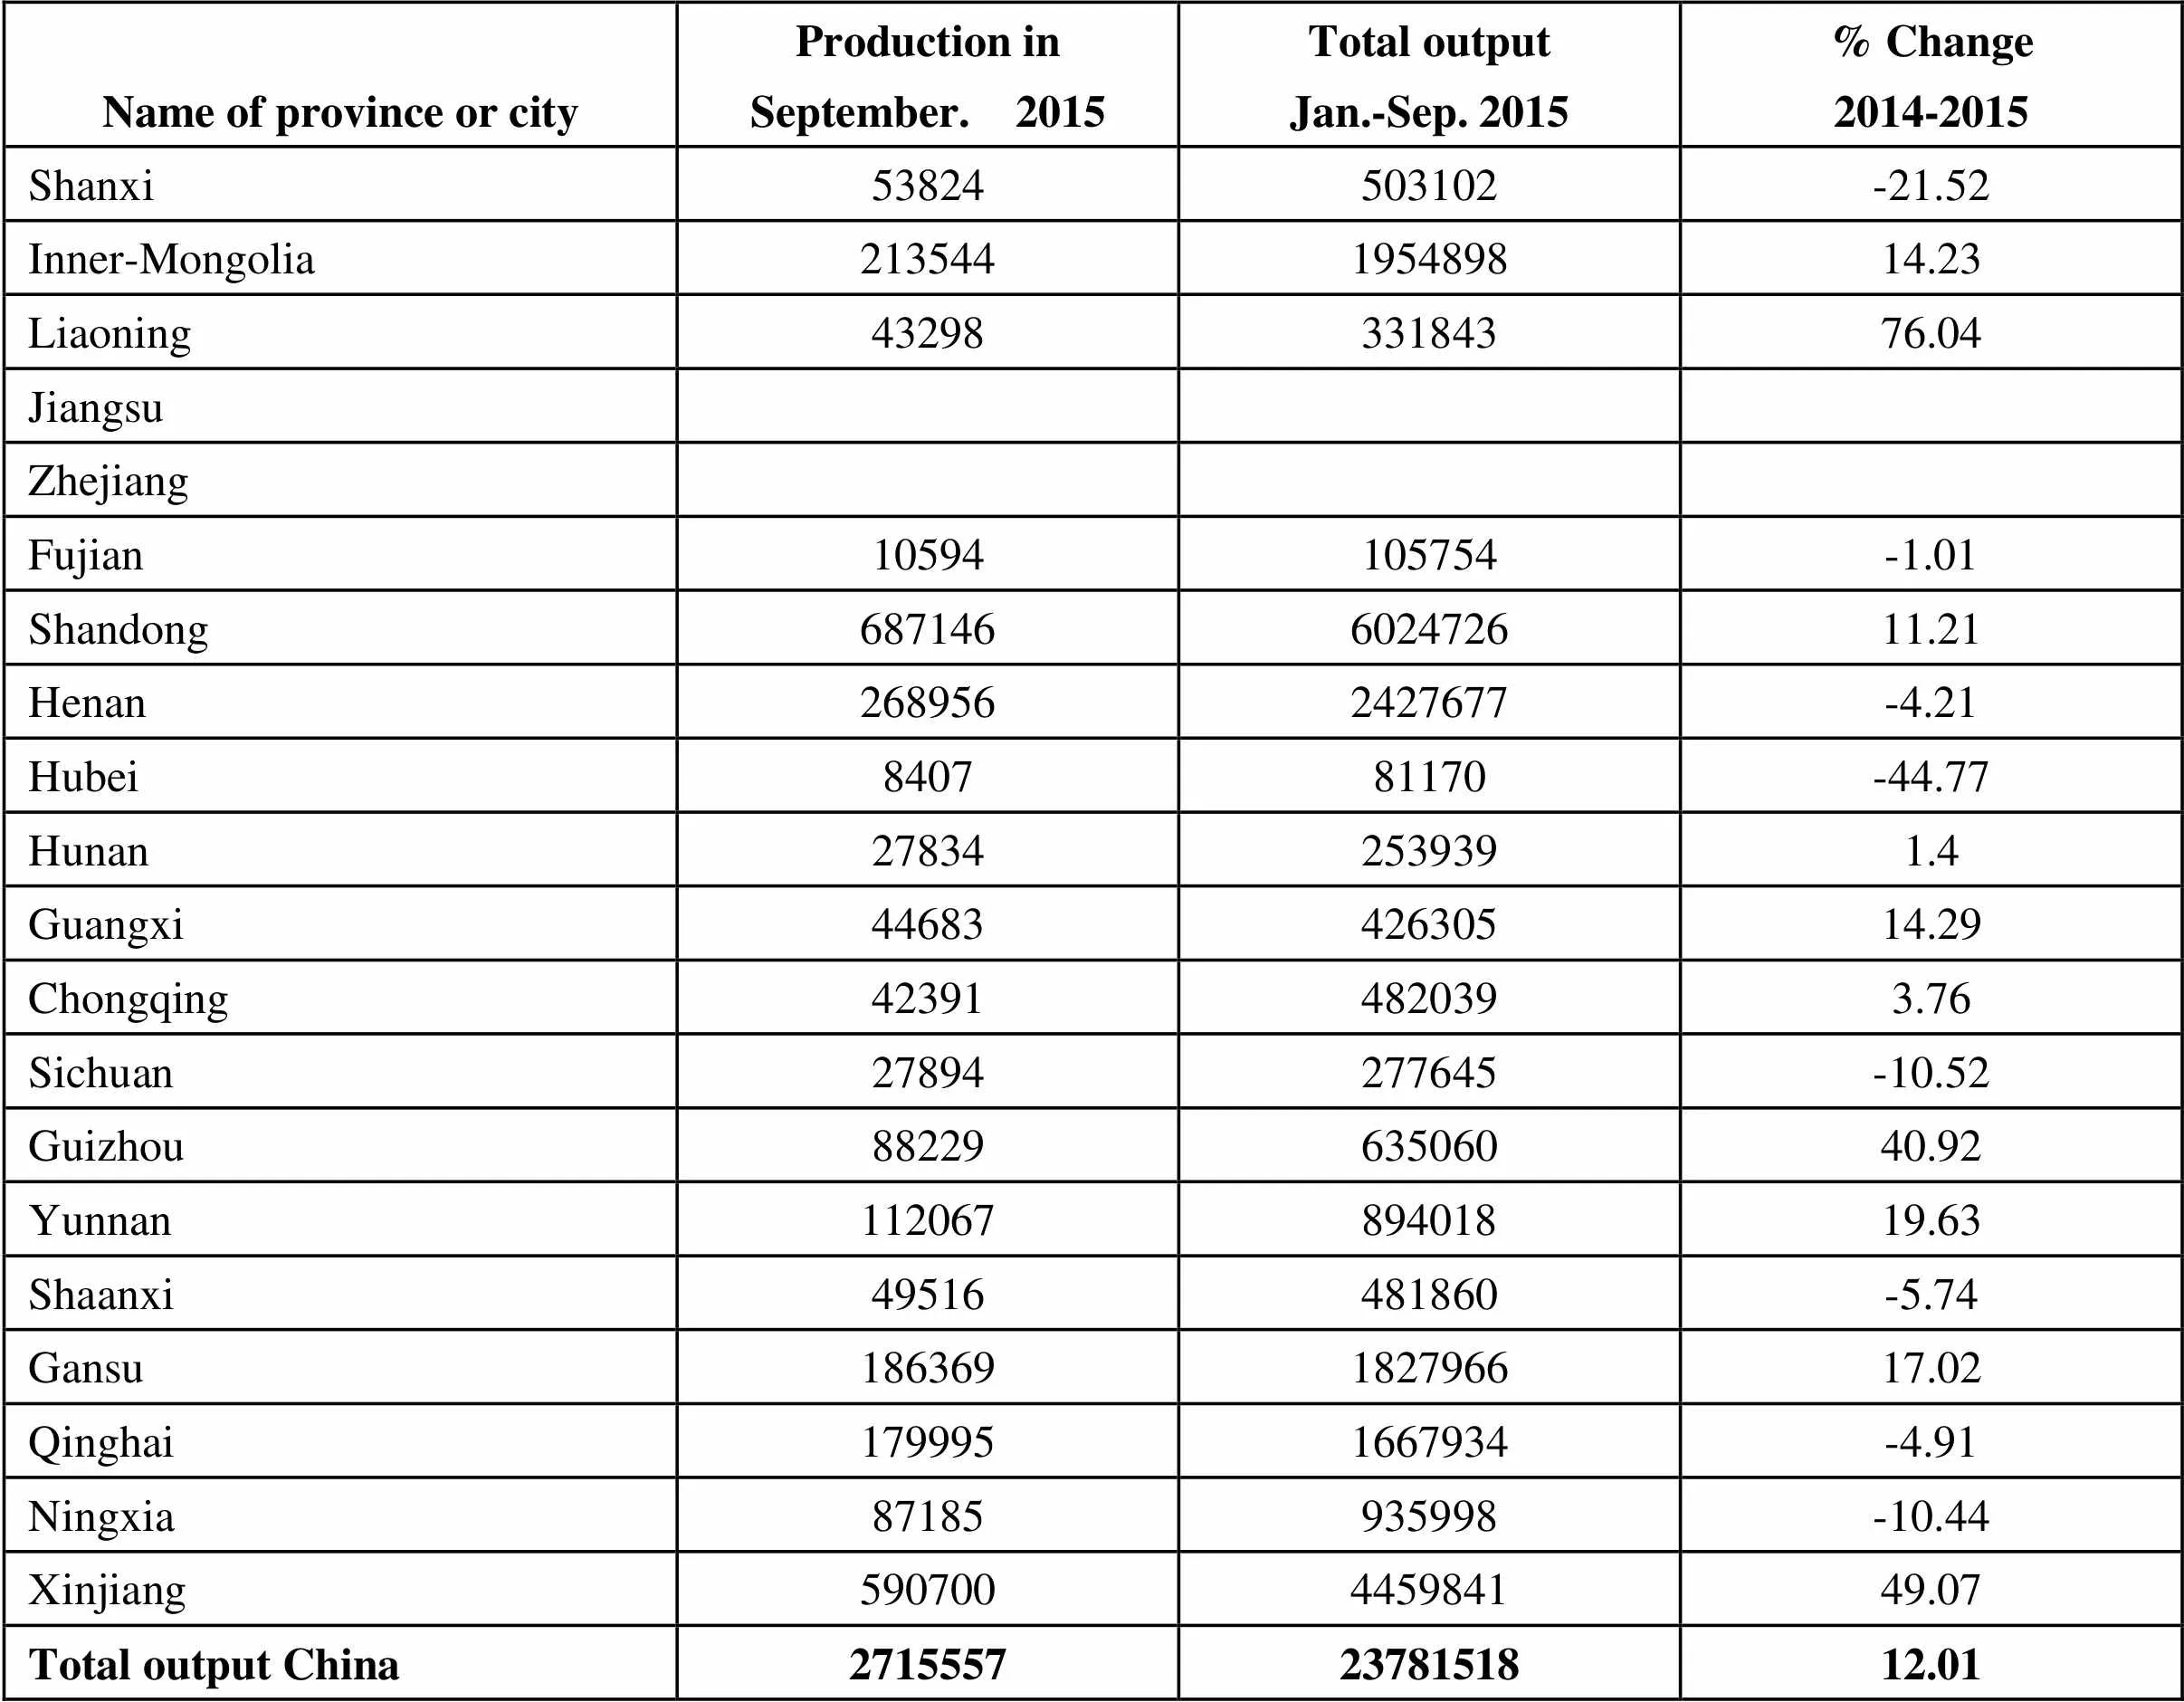
Name of province or cityProduction inSeptember. 2015Total outputJan.-Sep. 2015% Change2014-2015 Shanxi53824503102-21.52 Inner-Mongolia213544195489814.23 Liaoning4329833184376.04 Jiangsu Zhejiang Fujian10594105754-1.01 Shandong687146602472611.21 Henan2689562427677-4.21 Hubei840781170-44.77 Hunan278342539391.4 Guangxi4468342630514.29 Chongqing423914820393.76 Sichuan27894277645-10.52 Guizhou8822963506040.92 Yunnan11206789401819.63 Shaanxi49516481860-5.74 Gansu186369182796617.02 Qinghai1799951667934-4.91 Ningxia87185935998-10.44 Xinjiang590700445984149.07 Total output China27155572378151812.01
Unit: metric ton
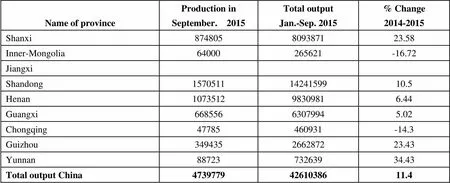
Name of province Production inSeptember. 2015Total outputJan.-Sep. 2015% Change2014-2015 Shanxi874805809387123.58 Inner-Mongolia64000265621-16.72 Jiangxi Shandong15705111424159910.5 Henan107351298309816.44 Guangxi66855663079945.02 Chongqing47785460931-14.3 Guizhou349435266287223.43 Yunnan8872373263934.43 Total output China47397794261038611.4
Unit: metric ton
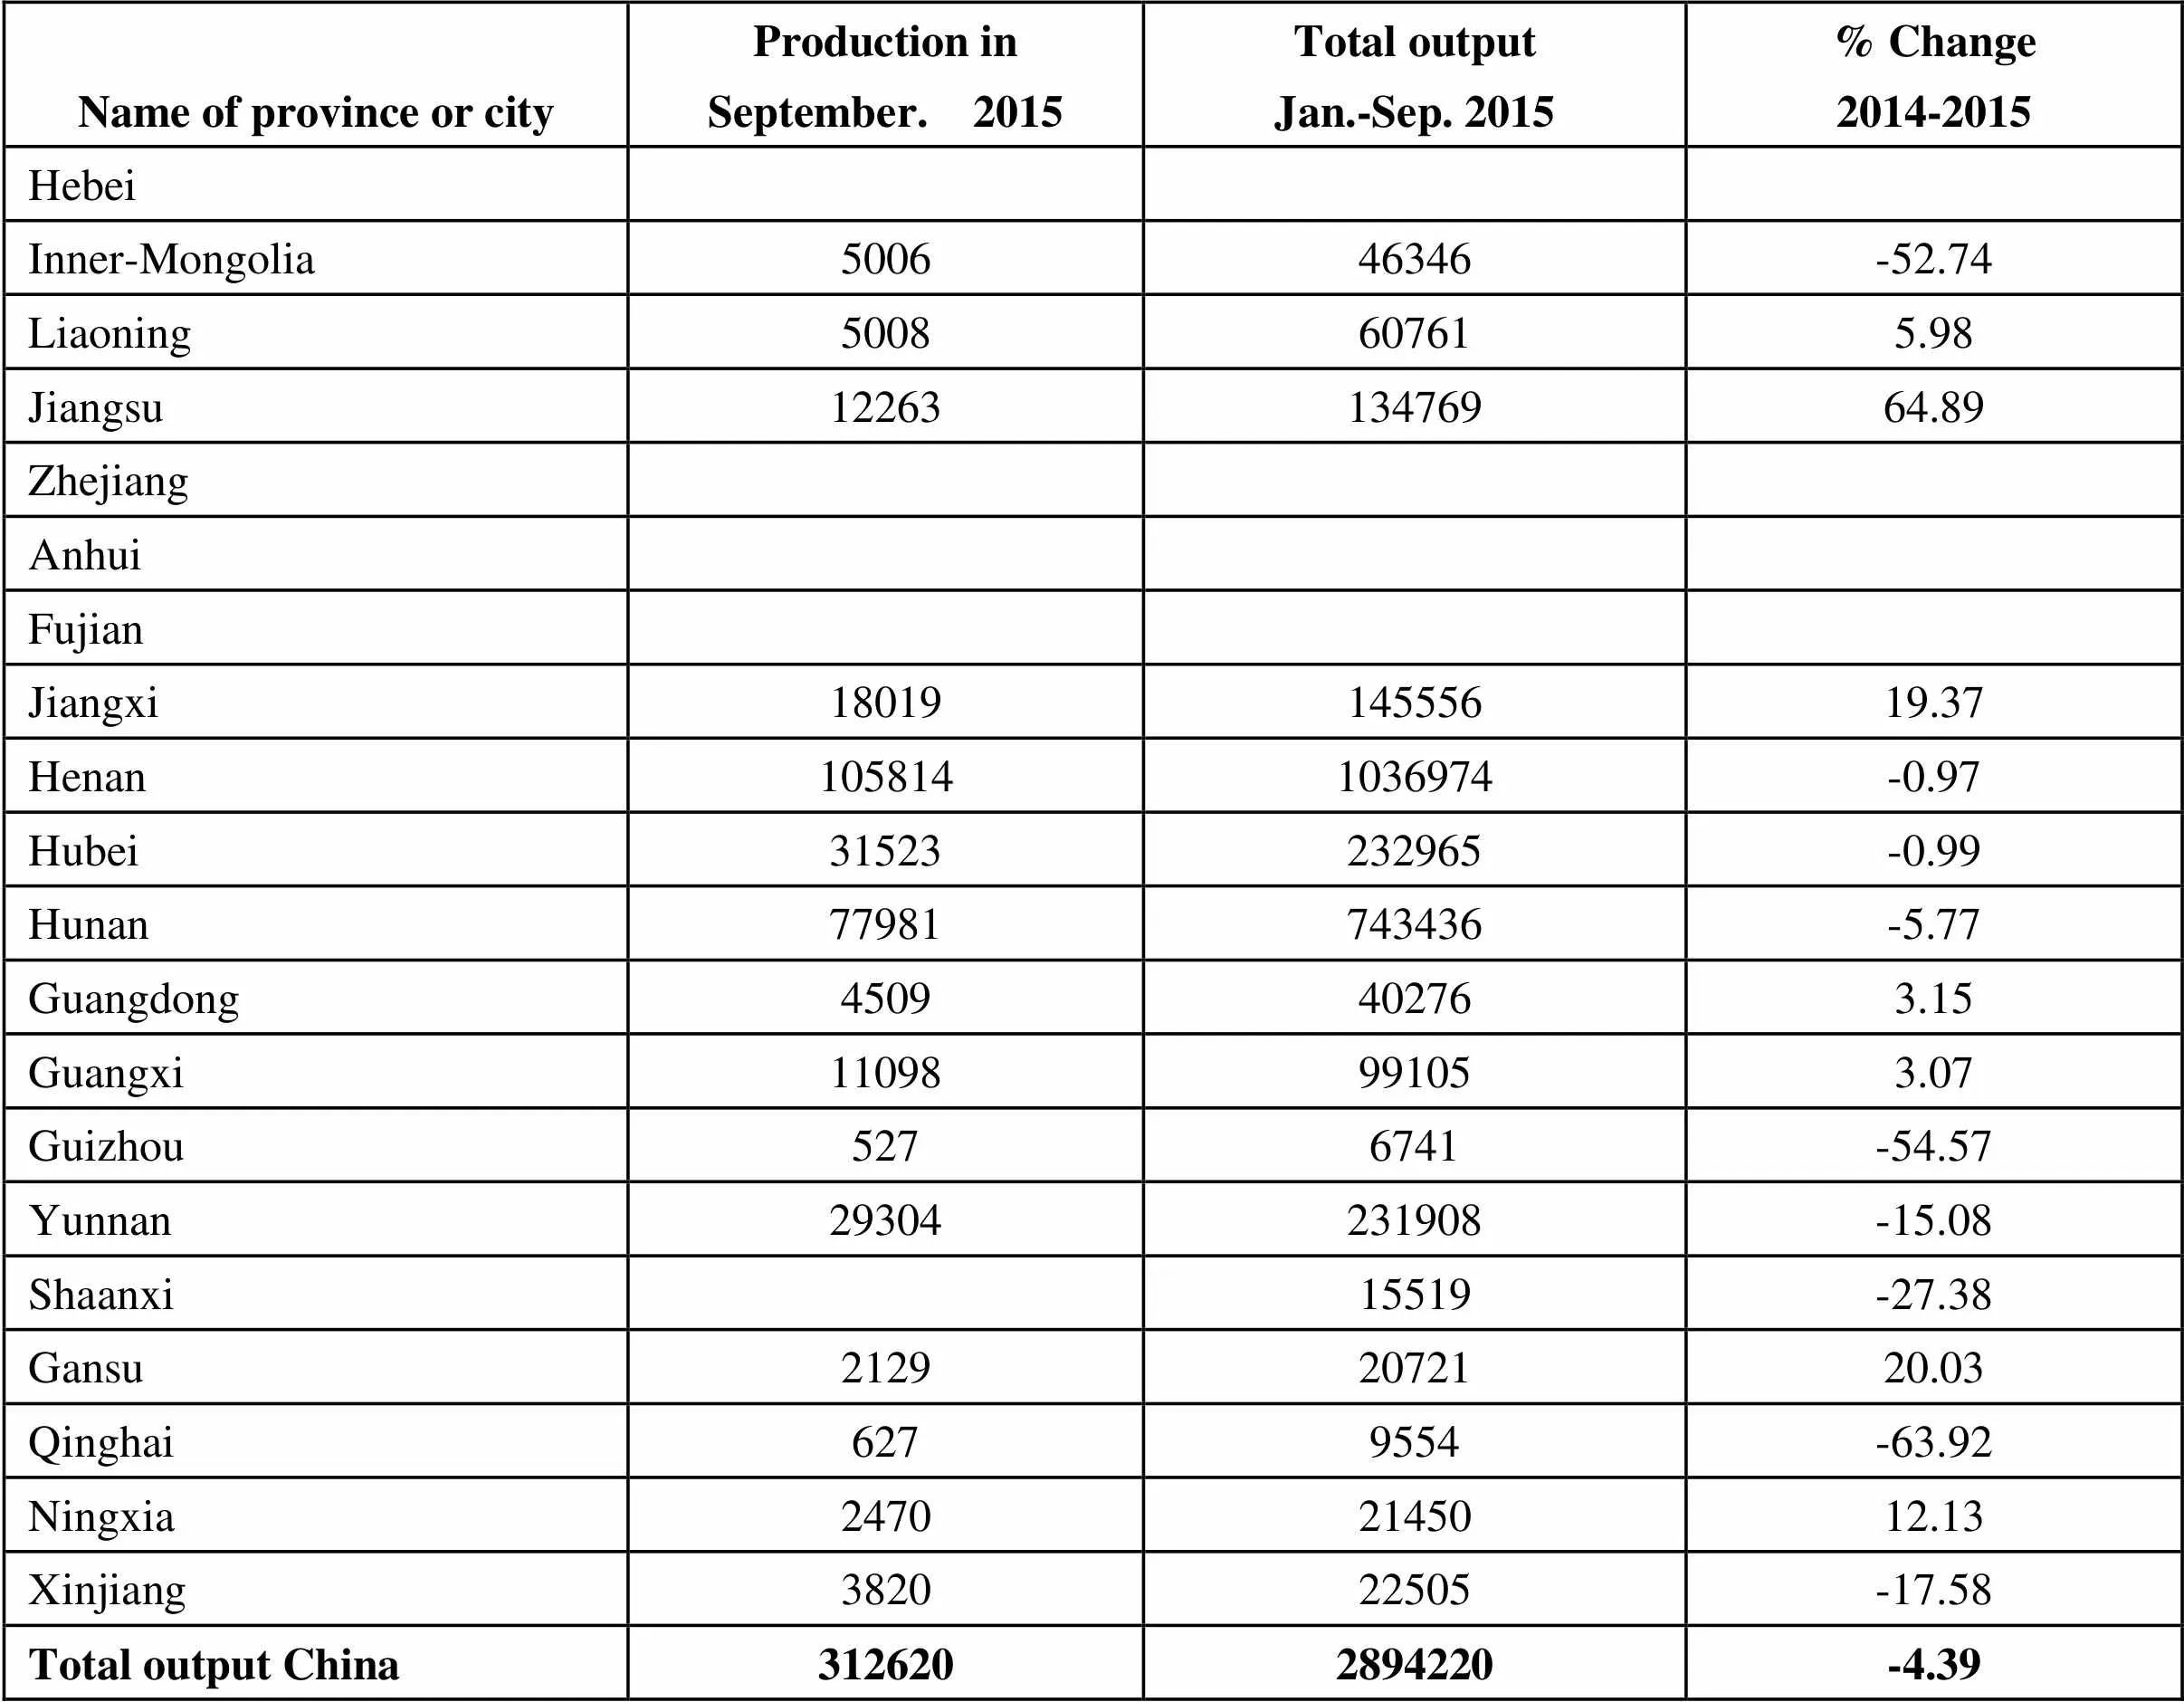
Name of province or cityProduction inSeptember. 2015Total outputJan.-Sep. 2015% Change2014-2015 Hebei Inner-Mongolia 500646346-52.74 Liaoning5008607615.98 Jiangsu1226313476964.89 Zhejiang Anhui Fujian Jiangxi1801914555619.37 Henan1058141036974-0.97 Hubei31523232965-0.99 Hunan77981743436-5.77 Guangdong4509402763.15 Guangxi11098991053.07 Guizhou5276741-54.57 Yunnan29304231908-15.08 Shaanxi15519-27.38 Gansu21292072120.03 Qinghai6279554-63.92 Ningxia24702145012.13 Xinjiang382022505-17.58 Total output China3126202894220-4.39
Unit: metric ton
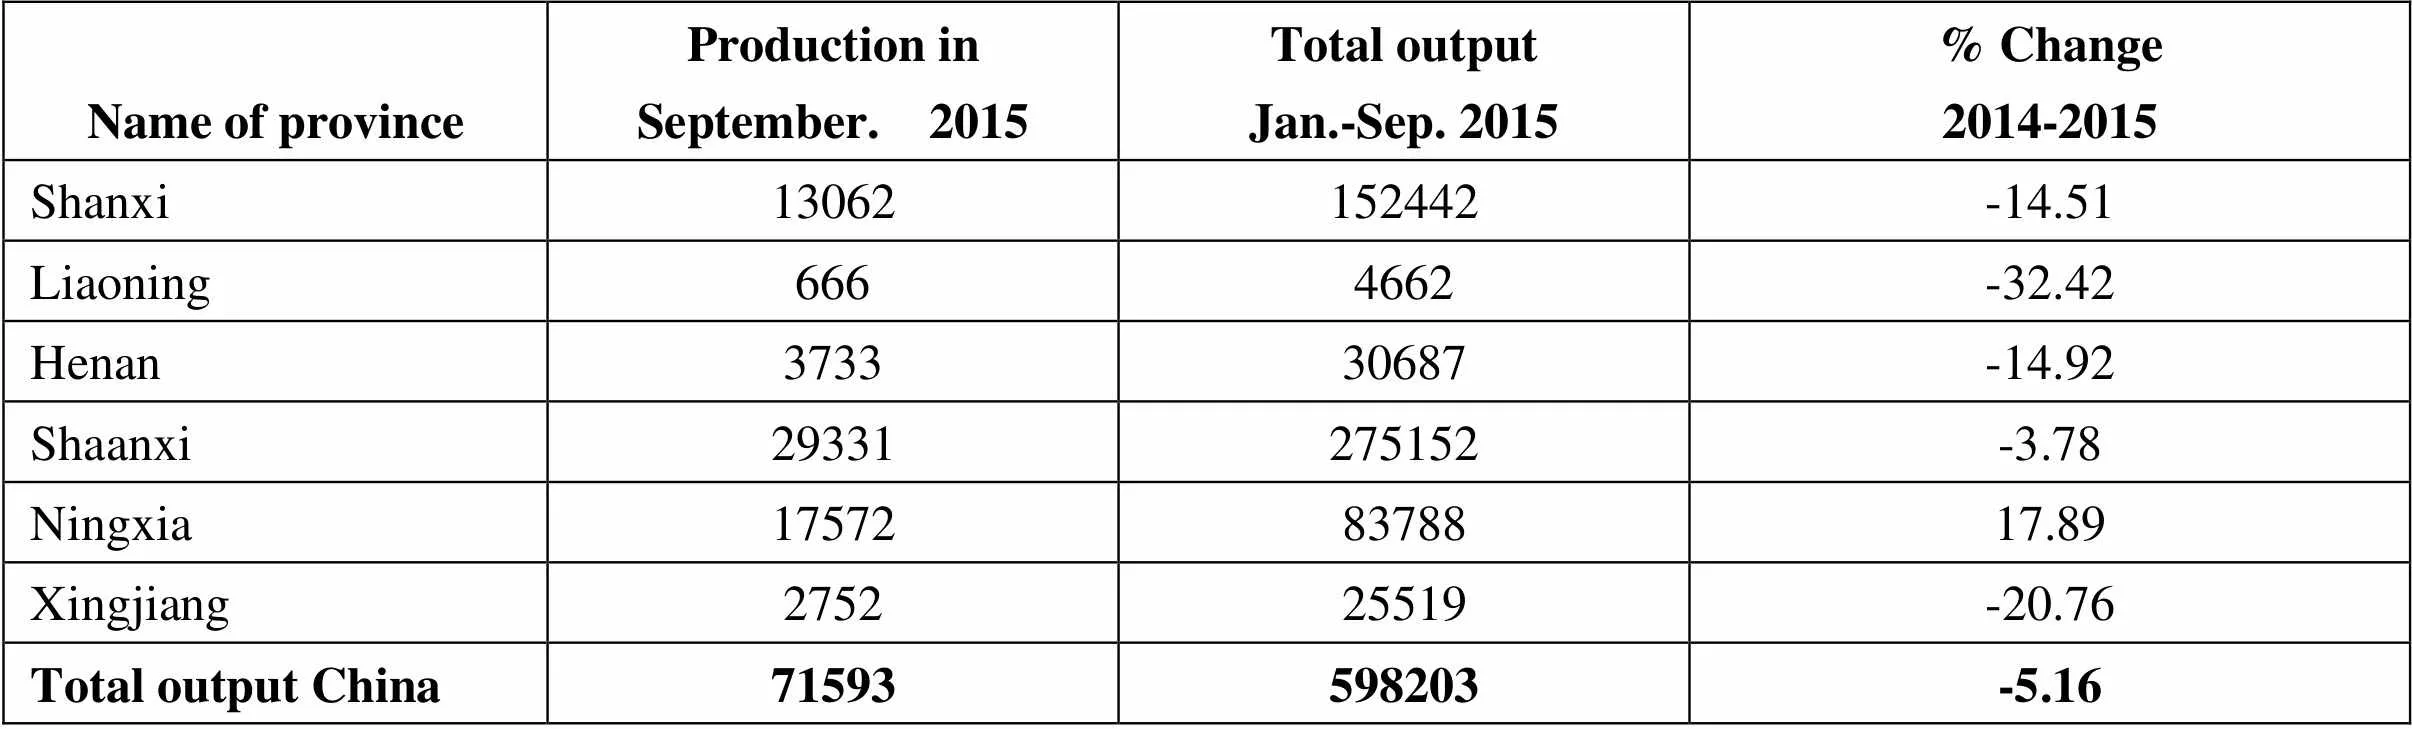
Name of provinceProduction inSeptember. 2015Total outputJan.-Sep. 2015% Change2014-2015 Shanxi13062152442-14.51 Liaoning6664662-32.42 Henan373330687-14.92 Shaanxi29331275152-3.78 Ningxia175728378817.89 Xingjiang275225519-20.76 Total output China71593598203-5.16
Unit: metric ton
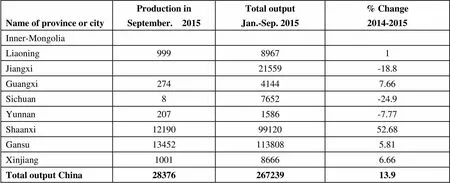
Name of province or cityProduction inSeptember. 2015Total outputJan.-Sep. 2015% Change2014-2015 Inner-Mongolia Liaoning99989671 Jiangxi21559-18.8 Guangxi27441447.66 Sichuan87652-24.9 Yunnan2071586-7.77 Shaanxi121909912052.68 Gansu134521138085.81 Xinjiang100186666.66 Total output China2837626723913.9
Unit: metric ton
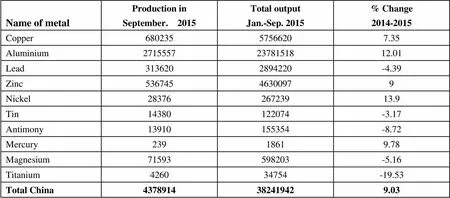
Name of metalProduction inSeptember. 2015Total outputJan.-Sep. 2015% Change2014-2015 Copper68023557566207.35 Aluminium27155572378151812.01 Lead3136202894220-4.39 Zinc53674546300979 Nickel2837626723913.9 Tin14380122074-3.17 Antimony13910155354-8.72 Mercury23918619.78 Magnesium71593598203-5.16 Titanium426034754-19.53 Total China4378914382419429.03
Unit: metric ton
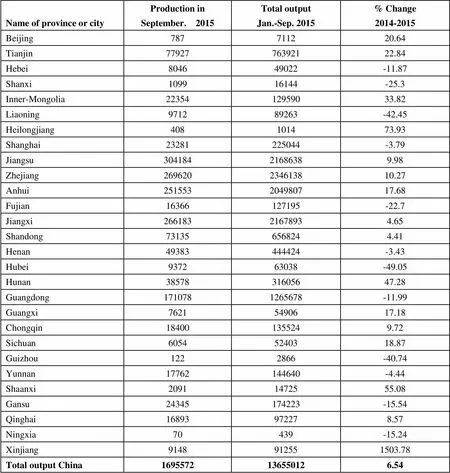
Name of province or cityProduction inSeptember. 2015Total outputJan.-Sep. 2015% Change2014-2015 Beijing787711220.64 Tianjin7792776392122.84 Hebei804649022-11.87 Shanxi109916144-25.3 Inner-Mongolia2235412959033.82 Liaoning971289263-42.45 Heilongjiang408101473.93 Shanghai23281225044-3.79 Jiangsu30418421686389.98 Zhejiang269620234613810.27 Anhui251553204980717.68 Fujian16366127195-22.7 Jiangxi26618321678934.65 Shandong731356568244.41 Henan49383444424-3.43 Hubei937263038-49.05 Hunan3857831605647.28 Guangdong1710781265678-11.99 Guangxi76215490617.18 Chongqin184001355249.72 Sichuan60545240318.87 Guizhou1222866-40.74 Yunnan17762144640-4.44 Shaanxi20911472555.08 Gansu24345174223-15.54 Qinghai16893972278.57 Ningxia70439-15.24 Xinjiang9148912551503.78 Total output China1695572136550126.54
(End of September. 2015)
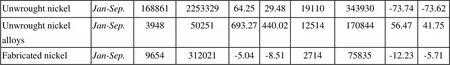
Name of commoditiesPeriodImportsExportsQuantity (metric ton)Value (thousand US dollars)% Change (2014-2015)Quantity (metric ton)Value (thousand US dollars)% Change (2014-2015)Copper:Copper concentrate (actual weight)Jan-Sep.81381011264320911.65-5.8140561891536636709Copper Scrap (actual weight)Jan-Sep.23406065745286-4.96-19.4899381-82.53-84.74Blister copperJan-Sep.3410262057311-16.31-28.25468528971328.85274.58Refined copper Jan-Sep.220106913288509-6.73-21.01147576903145-23.59-34.07Copper alloysJan-Sep.27323137143-12.2-21.781611163487.73401.01Fabricated copper productsJan-Sep.3702373411261-7.75-15.223201612481060-7.58-14.36Aluminium:AluminaJan-Sep.27638721039736-22.76-18.861209816623015.23-29.65Aluminium ScrapJan-Sep.23406065745286-4.96-19.48698134111.3633.73Primary AluminiumJan-Sep.91212191762-63.48-61.162276851334-72.05-69.46Aluminium alloysJan-Sep.4125397556-30.01-29.4346571739220-3.84-4.75Fabricated Aluminium productsJan-Sep.3163171906060-3.2-2.582866761895883931.4125.82Lead:Lead concentrateJan-Sep.10302911202511-6.56-7.871064351-38.3-73.8Unwrought refined leadJan-Sep.21457435.1621.74344806762352.0740.07Unwrought refined lead alloys Jan-Sep.1106625862-44.54-44.491044342567.9496.73Fabricated LeadJan-Sep.828330865-12.64-10.471521533733-18.89-24.3Zinc:Zinc concentrate (actual weight)Jan-Sep.2019477134197161.4756.1787106295-32.3-41.22Unwrought refined ZincJan-Sep.265619580384-44.64-43.5286635193409141.39143.34Unwrought refined Zinc alloysJan-Sep.69352168342-2.382.755771441-40.62-26.88Fabricated ZincJan-Sep.828330865-12.64-10.479219661282.2739.55Tin:Unwrought refined tin Jan-Sep.606610750327.51-2.9424387-94.55-95.96Unwrought refined tin alloysJan-Sep.53011187-13.79-20.591-72.93-100Nickel:Unwrought nickel Jan-Sep.168861225332964.2529.4819110343930-73.74-73.62Unwrought nickel alloysJan-Sep.394850251693.27440.021251417084456.4741.75Fabricated nickelJan-Sep.9654312021-5.04-8.51271475835-12.23-5.71
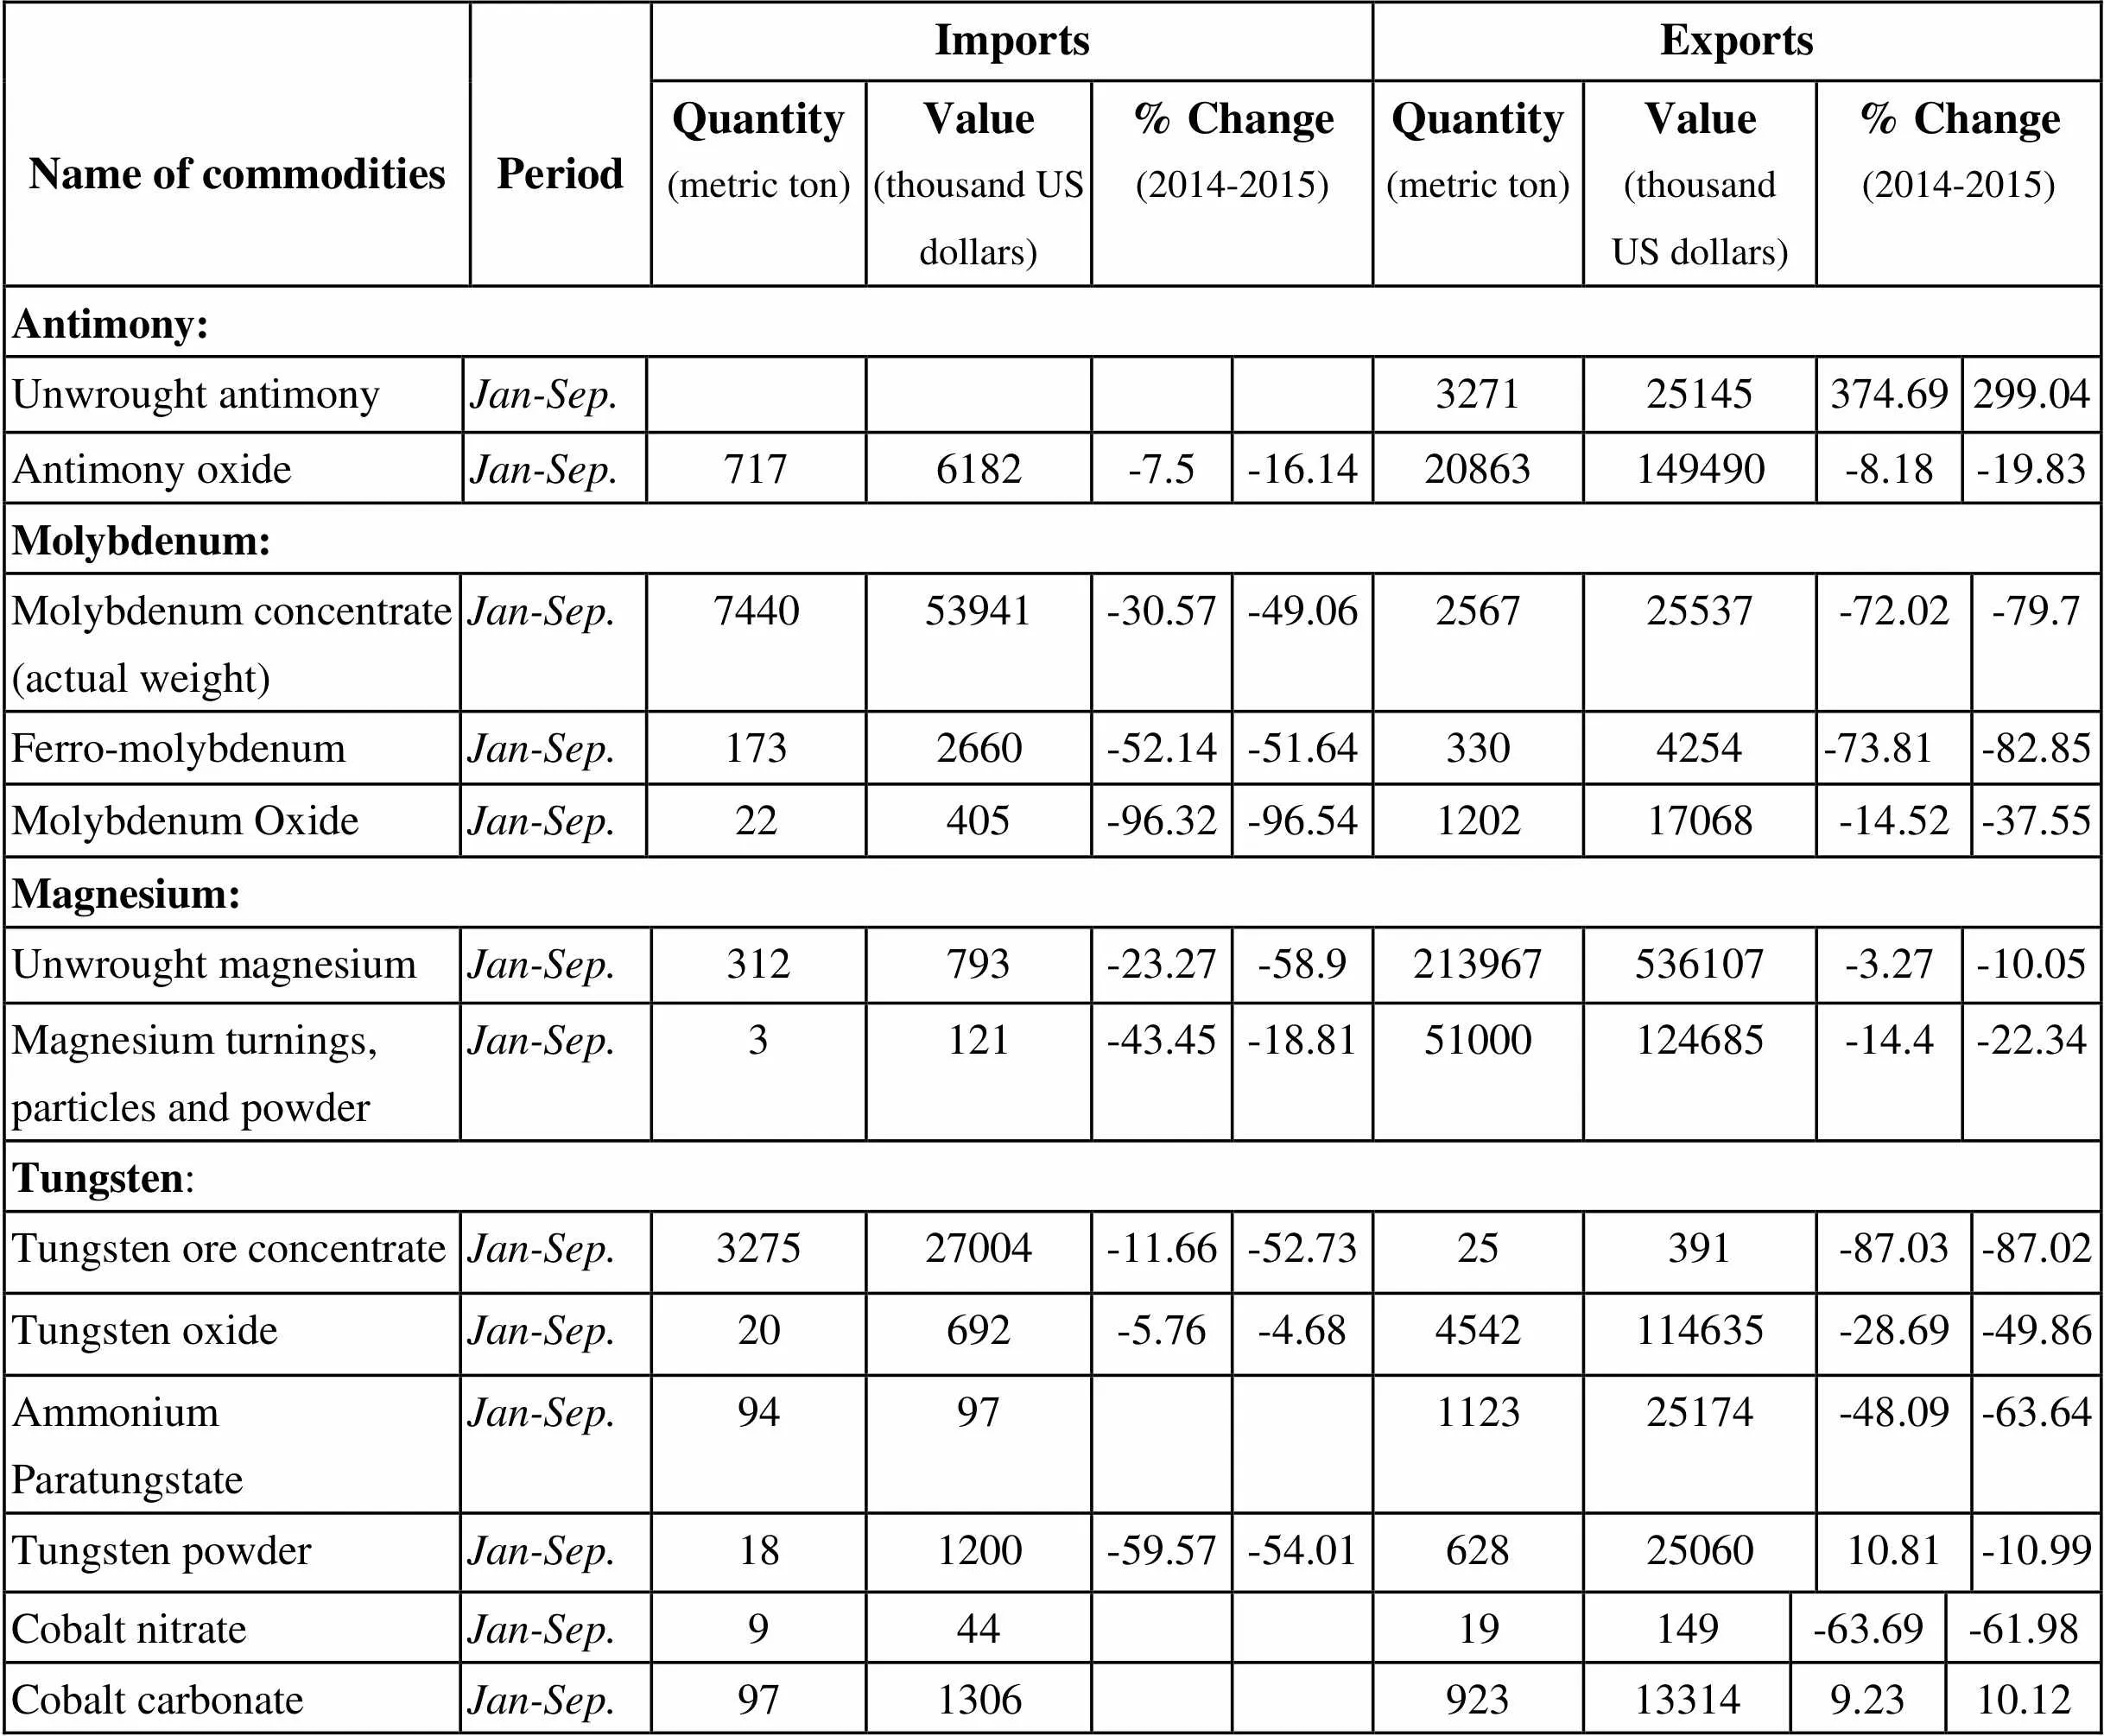
Name of commoditiesPeriodImportsExportsQuantity (metric ton)Value (thousand US dollars)% Change (2014-2015)Quantity (metric ton)Value (thousand US dollars)% Change (2014-2015)Antimony:Unwrought antimony Jan-Sep.327125145374.69299.04Antimony oxideJan-Sep.7176182-7.5-16.1420863149490-8.18-19.83Molybdenum:Molybdenum concentrate (actual weight)Jan-Sep.744053941-30.57-49.06256725537-72.02-79.7Ferro-molybdenumJan-Sep.1732660-52.14-51.643304254-73.81-82.85Molybdenum OxideJan-Sep.22405-96.32-96.54120217068-14.52-37.55Magnesium:Unwrought magnesiumJan-Sep.312793-23.27-58.9213967536107-3.27-10.05Magnesium turnings, particles and powderJan-Sep.3121-43.45-18.8151000124685-14.4-22.34Tungsten:Tungsten ore concentrateJan-Sep.327527004-11.66-52.7325391-87.03-87.02Tungsten oxideJan-Sep.20692-5.76-4.684542114635-28.69-49.86Ammonium Paratungstate Jan-Sep.9497112325174-48.09-63.64Tungsten powderJan-Sep.181200-59.57-54.016282506010.81-10.99 Tungsten carbide powderJan-Sep.2819427.69-11.2722358630347.2413 Ferro-tungstenJan-Sep.20252-68.85-67.96105227354220.2497.24 Silver: (unit in kg) Unwrought silverJan-Sep.568887285368165.56224.51130284370689077.3439.62 Silver powderJan-Sep.1023746133705-3.110.7117291249-55.09-72.26 Semi-finished silverJan-Sep.464180589291.77-15.391062355654421663496 Silver ornamentsJan-Sep.245635103445.3547.7168162462774-12.44-18.69 Silverware Jan-Sep.10771265-11.7616.881013623850-26.9617 Gold: (unit in kg) Gold ornamentsJan-Sep.47392902924.288.631309778448955-55.96-61.73 Titanium: Fabricated titaniumJan-Sep.388430831521.726.0579381911453.9-4.46 Titanium concentratesJan-Sep.1273532190833-5.02-33.812820912407126.483.1 Titanium dioxideJan-Sep.1404053587003.53-4.14357135668943-4.94-13.02 Cobalt: Cobalt and Fabricated cobaltJan-Sep.11814563165549.1337.4200263928-3.42-2.34 Cobalt concentratesJan-Sep.16027632195232.4734.76 Cobalt oxideJan-Sep.9597594207.416.925110116707-23.64-24.77 Cobalt nitrateJan-Sep.94419149-63.69-61.98 Cobalt carbonateJan-Sep.971306923133149.2310.12
Unit: metric ton
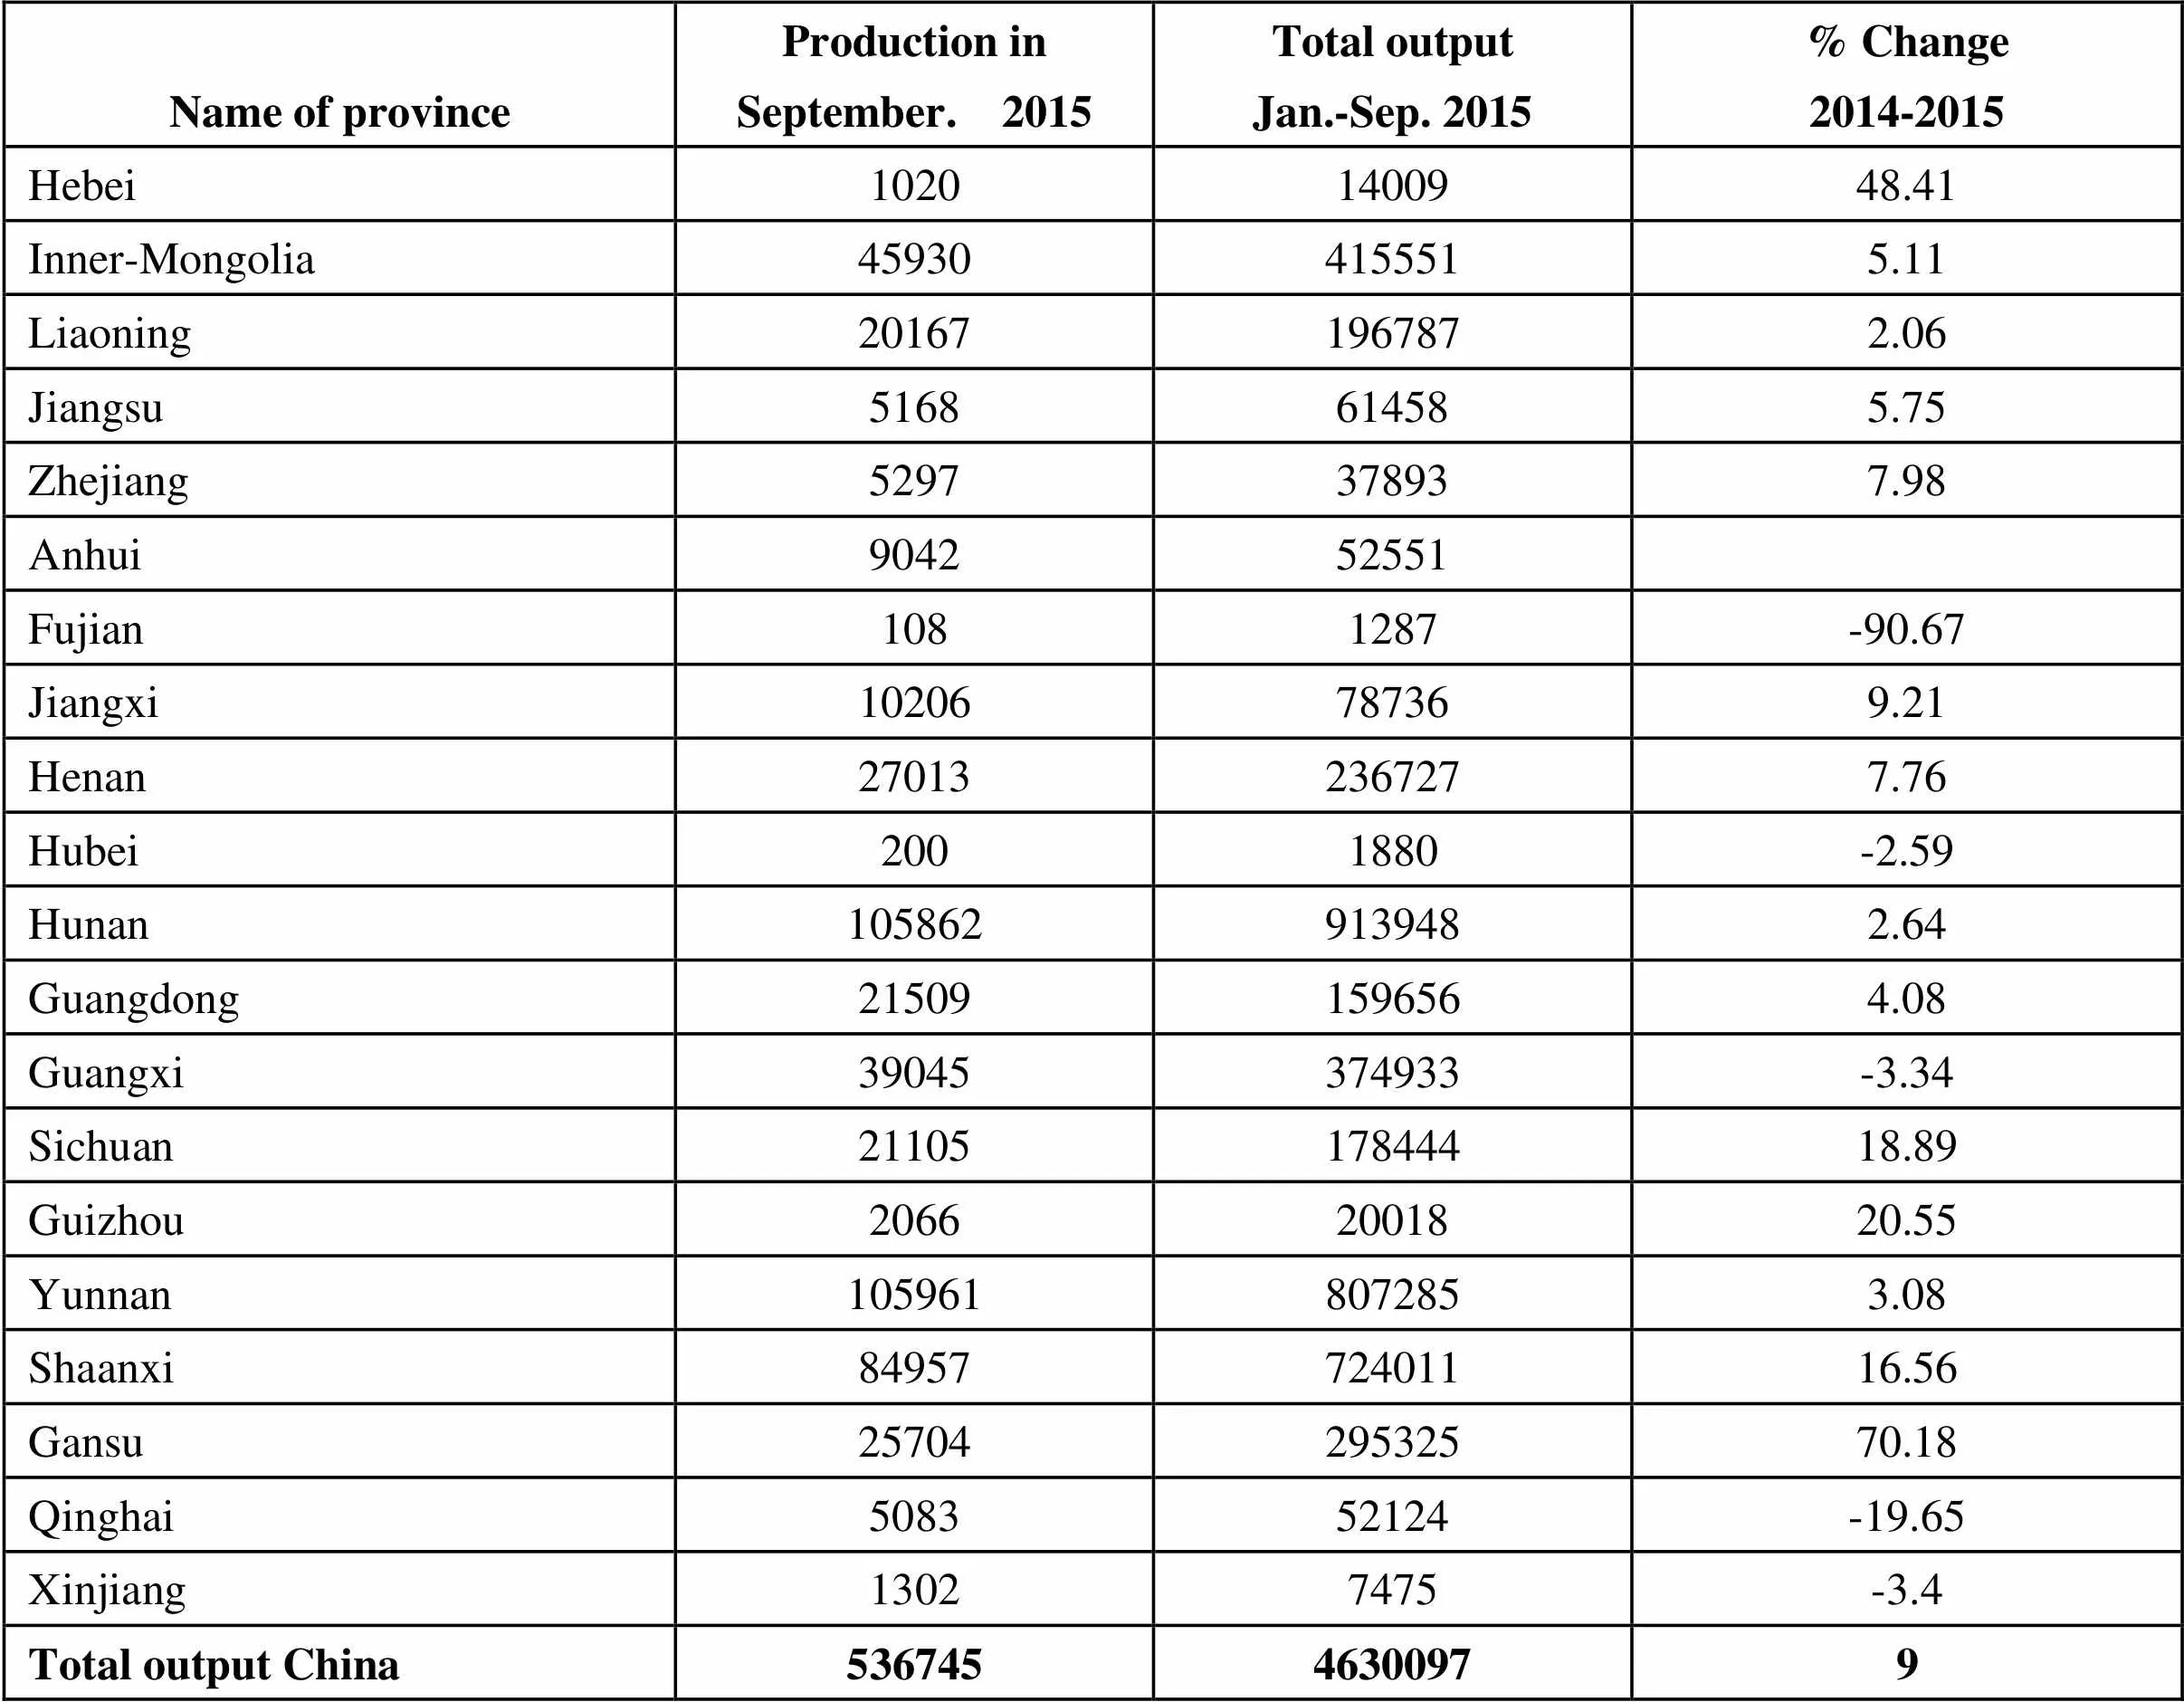
Name of provinceProduction inSeptember. 2015Total outputJan.-Sep. 2015% Change2014-2015 Hebei10201400948.41 Inner-Mongolia459304155515.11 Liaoning201671967872.06 Jiangsu5168614585.75 Zhejiang5297378937.98 Anhui904252551 Fujian1081287-90.67 Jiangxi10206787369.21 Henan270132367277.76 Hubei2001880-2.59 Hunan1058629139482.64 Guangdong215091596564.08 Guangxi39045374933-3.34 Sichuan2110517844418.89 Guizhou20662001820.55 Yunnan1059618072853.08 Shaanxi8495772401116.56 Gansu2570429532570.18 Qinghai508352124-19.65 Xinjiang13027475-3.4 Total output China53674546300979
 China Nonferrous Metals Monthly2015年11期
- China Nonferrous Metals Monthly的其它文章
- Fujian Provincial Government Signed Cooperation Agreement with Chinalco
- Jiangxi Copper Made Strategic Investment in Hami with Rich Nonferrous Metal Resources
- Innovation and Upgrading to Fulfill Large-scale Application of Magnesium Industry
- Zunyi Molybdenum & Nickel Mining Enterprises Are Still in Suspension Status
- Qinghai 100 Billion Yuan Lithium Industry Base Has Initially Taken Shape
- Due To Surplus in Aluminum Capacity, a Number of Enterprises Experienced Loss to Varying Degrees