
Joint Production Cut of Henan Lead Enterprises is Still Under Negotiation
2015-11-21 08:32:00
China Nonferrous Metals Monthly 2015年2期
?
Joint Production Cut of Henan Lead Enterprises is Still Under Negotiation
On January 16, according to media report, Henan joint production cut was still under negotiation, the production cut volume is expected to be determined between February and March; nevertheless, in fact we consider the so-called production cut agreement is relatively difficult to come true, this is because even in Henan local area, different enterprises adopt different raw materials, and have different bottom line of tolerance toward lead price.
For lead enterprises that use scrapped and old batteries as raw materials, they basically have no price bottom line problem, among large lead enterprises in Henan, at least there are 1-2 enterprises whose percentage of secondary raw materials is high, it is uncertain whether or not they are willing to cut production. Furthermore, even among primary lead enterprises, the conditions differ greatly, the main reason lies in the percentage of self-owned mine; overall speaking, currently enterprises relying on external purchase of lead ore concentrate are facing huge pressure, but Henan’s total lead output accounts for less than 1/3 of the national total, even if there is 30% production cut, the impact of total output on national lead price is merely 10%, such production cut volume actually will only aggravate the shortage in lead market in regions north of the Yangtze River, and cannot change the fundamental trend of lead price.
Furthermore, production cut involves market share, therefore actually it’s relatively difficult to reach agreement, we consider the most possible outcome is symbolic production cut, moreover, generally lead enterprises compile current year’s production plan at the beginning of the year, therefore after the lead output figures in February and March are published, it will be very easy to judge whether it’s real or false production cut. Nonetheless, at present regardless of the result of production cut by Henan lead enterprises, the fundamental situation of lead price itself can already guarantee lead price will hardly fall, if Henan lead enterprises can cut reduction as scheduled, it will be still better.
Unit: metric ton
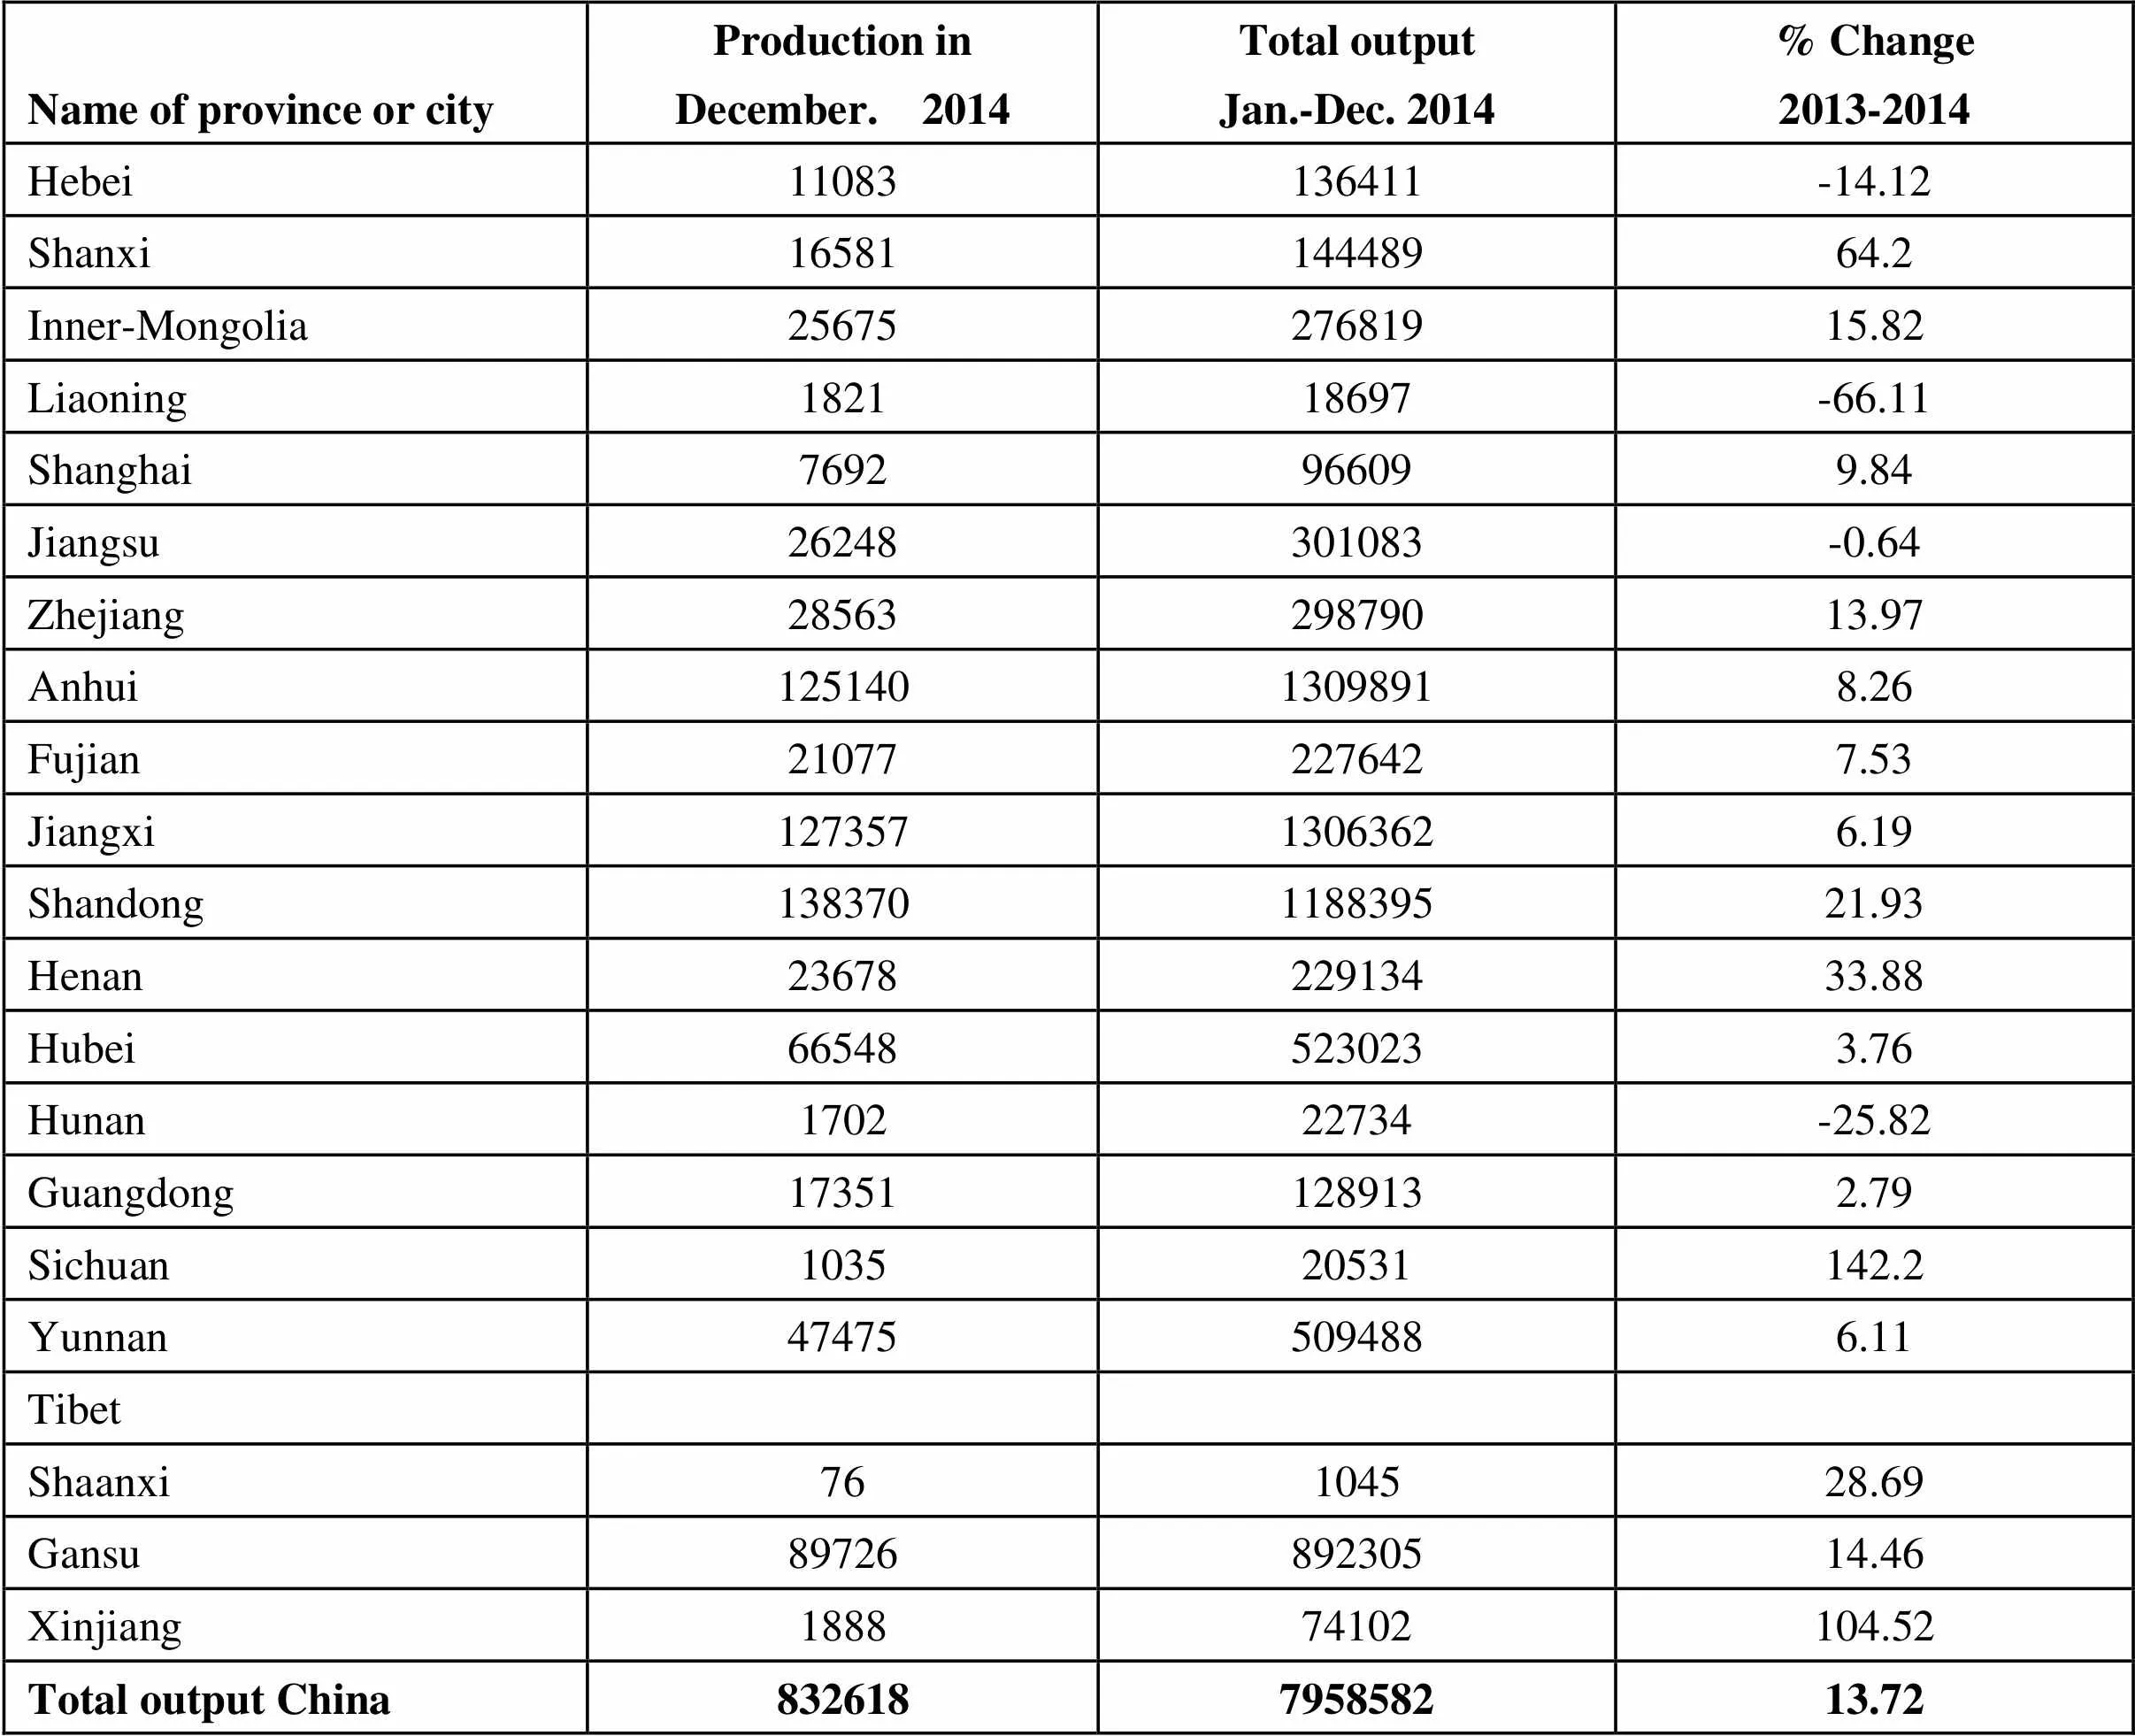
Name of province or cityProduction inDecember. 2014Total outputJan.-Dec. 2014% Change2013-2014 Hebei11083136411-14.12 Shanxi1658114448964.2 Inner-Mongolia2567527681915.82 Liaoning182118697-66.11 Shanghai7692966099.84 Jiangsu26248301083-0.64 Zhejiang2856329879013.97 Anhui12514013098918.26 Fujian210772276427.53 Jiangxi12735713063626.19 Shandong138370118839521.93 Henan2367822913433.88 Hubei665485230233.76 Hunan170222734-25.82 Guangdong173511289132.79 Sichuan103520531142.2 Yunnan474755094886.11 Tibet Shaanxi76104528.69 Gansu8972689230514.46 Xinjiang188874102104.52 Total output China832618795858213.72
Unit: metric ton
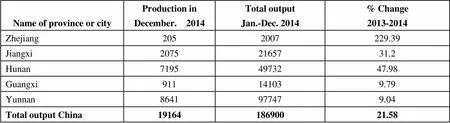
Name of province or cityProduction inDecember. 2014Total outputJan.-Dec. 2014% Change2013-2014 Zhejiang2052007229.39 Jiangxi20752165731.2 Hunan71954973247.98 Guangxi911141039.79 Yunnan8641977479.04 Total output China1916418690021.58
Unit: metric ton
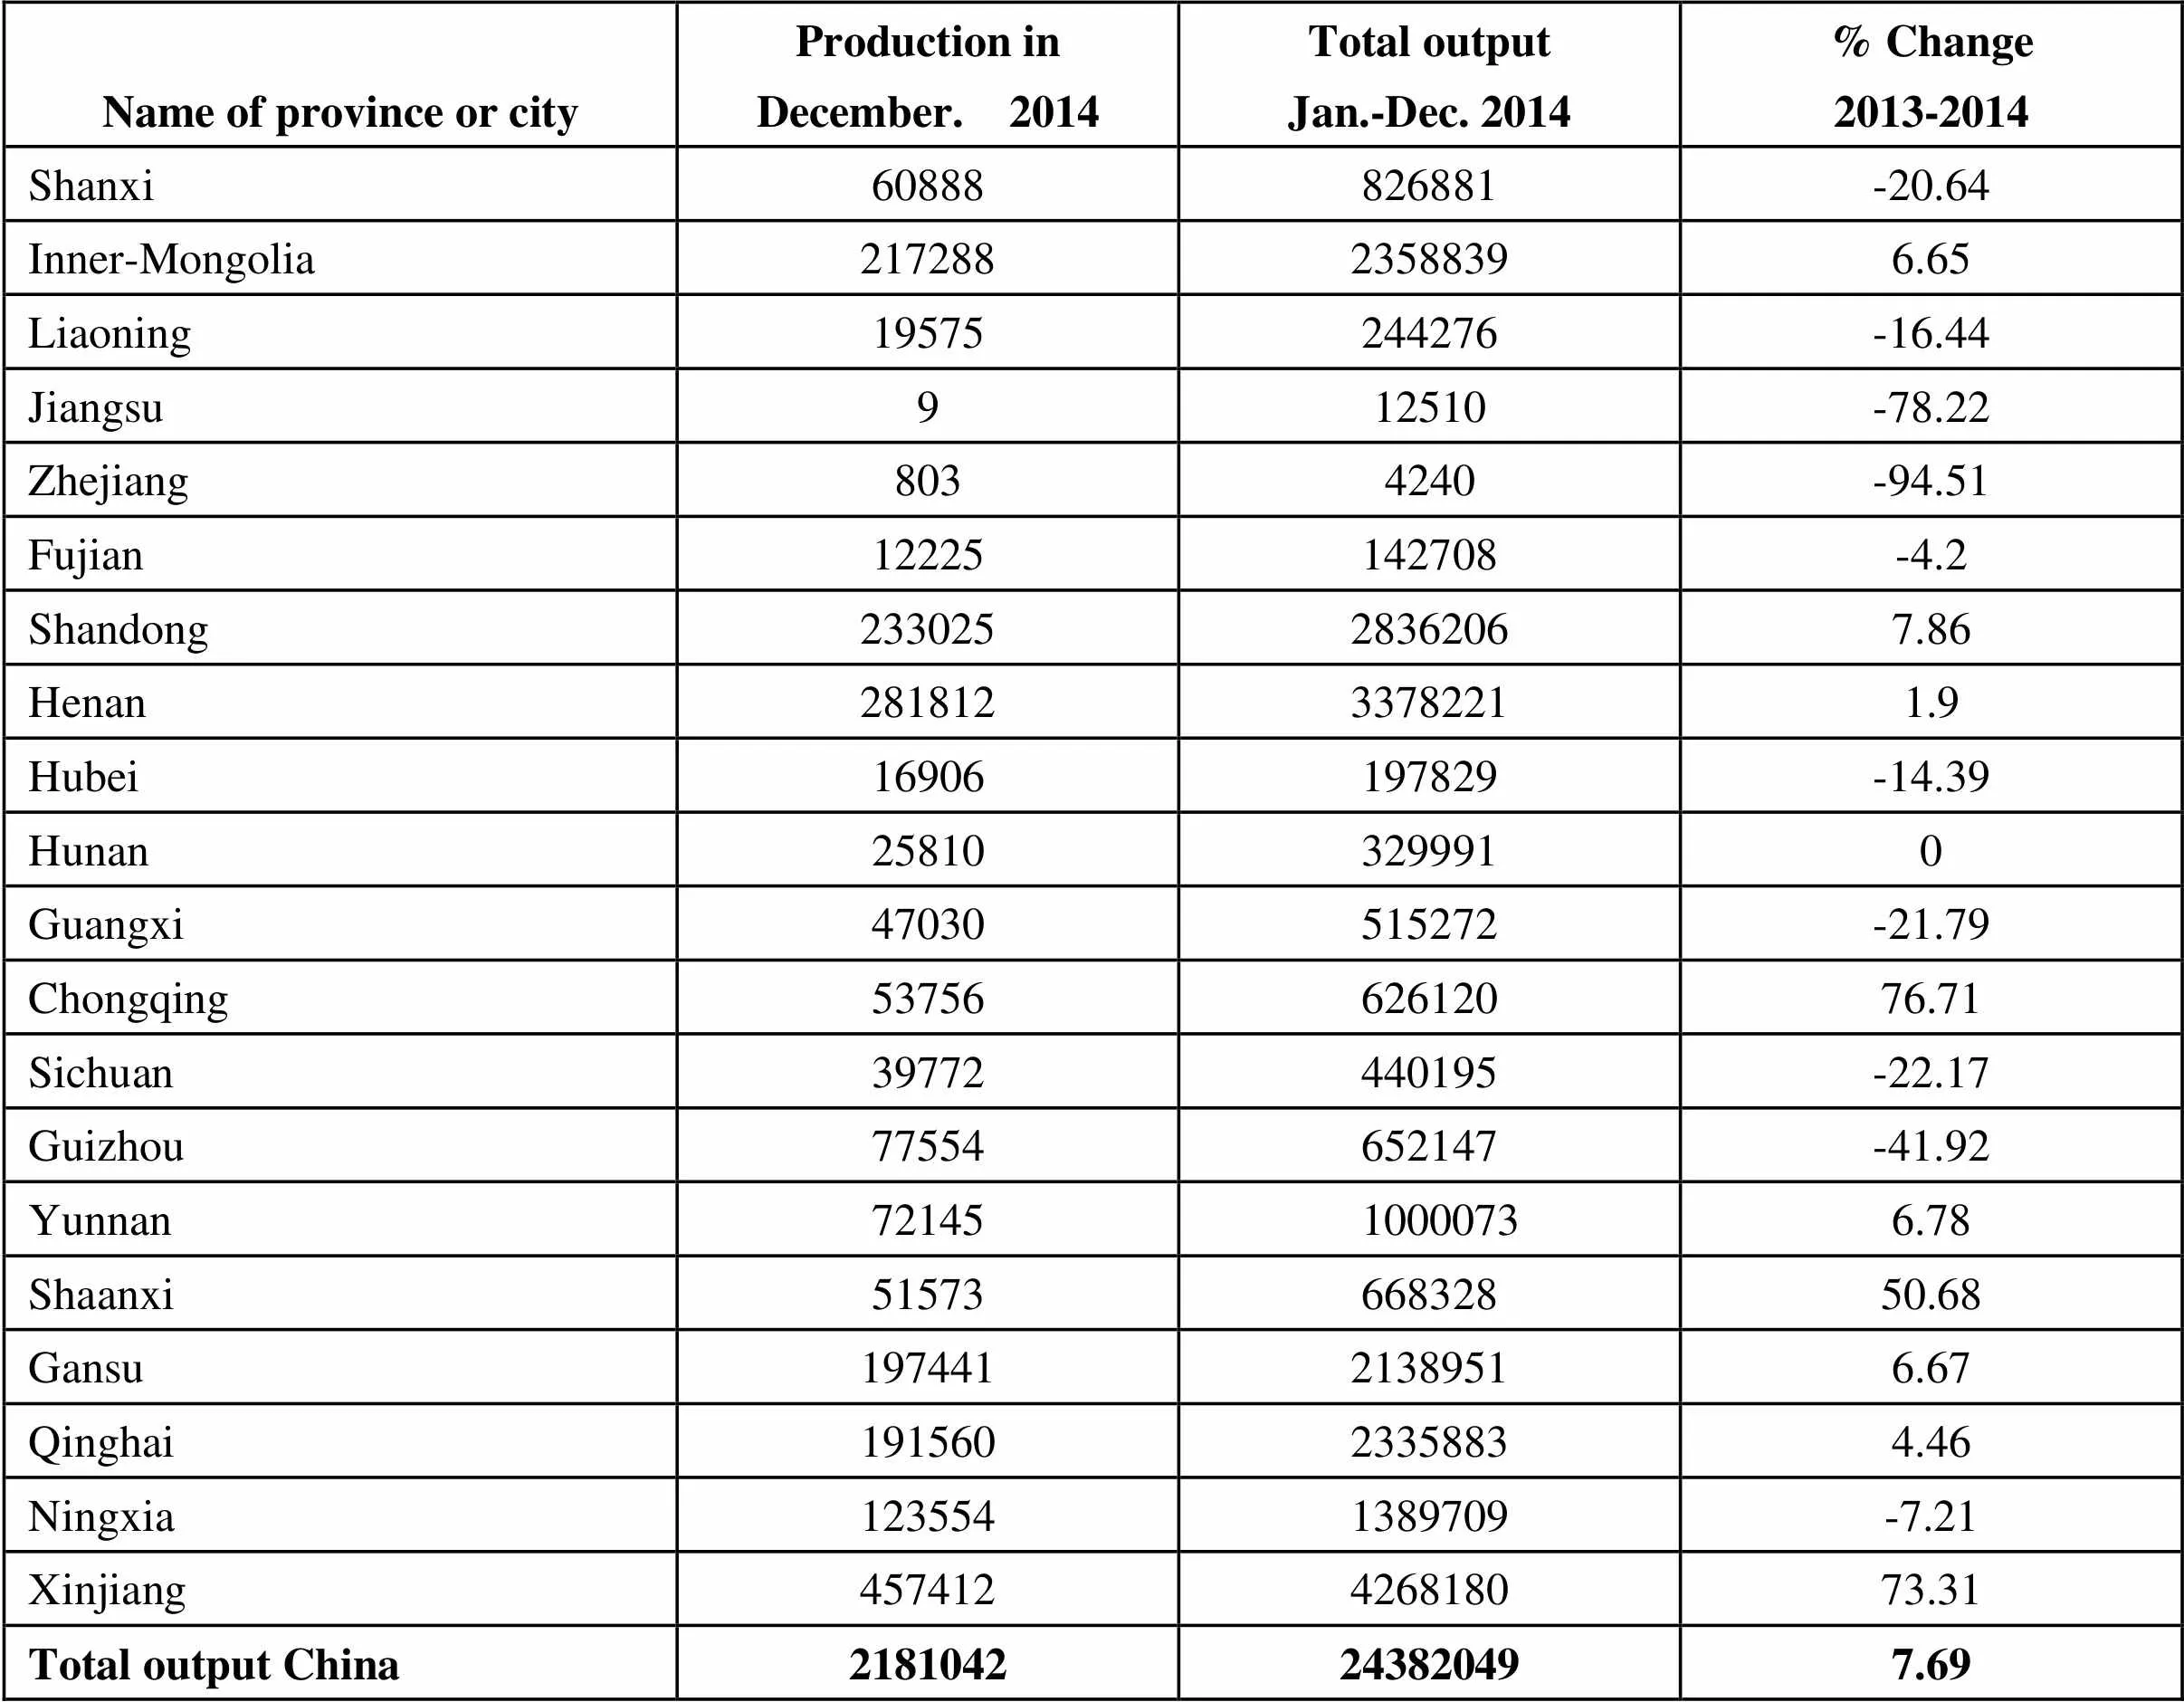
Name of province or cityProduction inDecember. 2014Total outputJan.-Dec. 2014% Change2013-2014 Shanxi60888826881-20.64 Inner-Mongolia21728823588396.65 Liaoning19575244276-16.44 Jiangsu912510-78.22 Zhejiang8034240-94.51 Fujian12225142708-4.2 Shandong23302528362067.86 Henan28181233782211.9 Hubei16906197829-14.39 Hunan258103299910 Guangxi47030515272-21.79 Chongqing5375662612076.71 Sichuan39772440195-22.17 Guizhou77554652147-41.92 Yunnan7214510000736.78 Shaanxi5157366832850.68 Gansu19744121389516.67 Qinghai19156023358834.46 Ningxia1235541389709-7.21 Xinjiang457412426818073.31 Total output China2181042243820497.69
Unit: metric ton
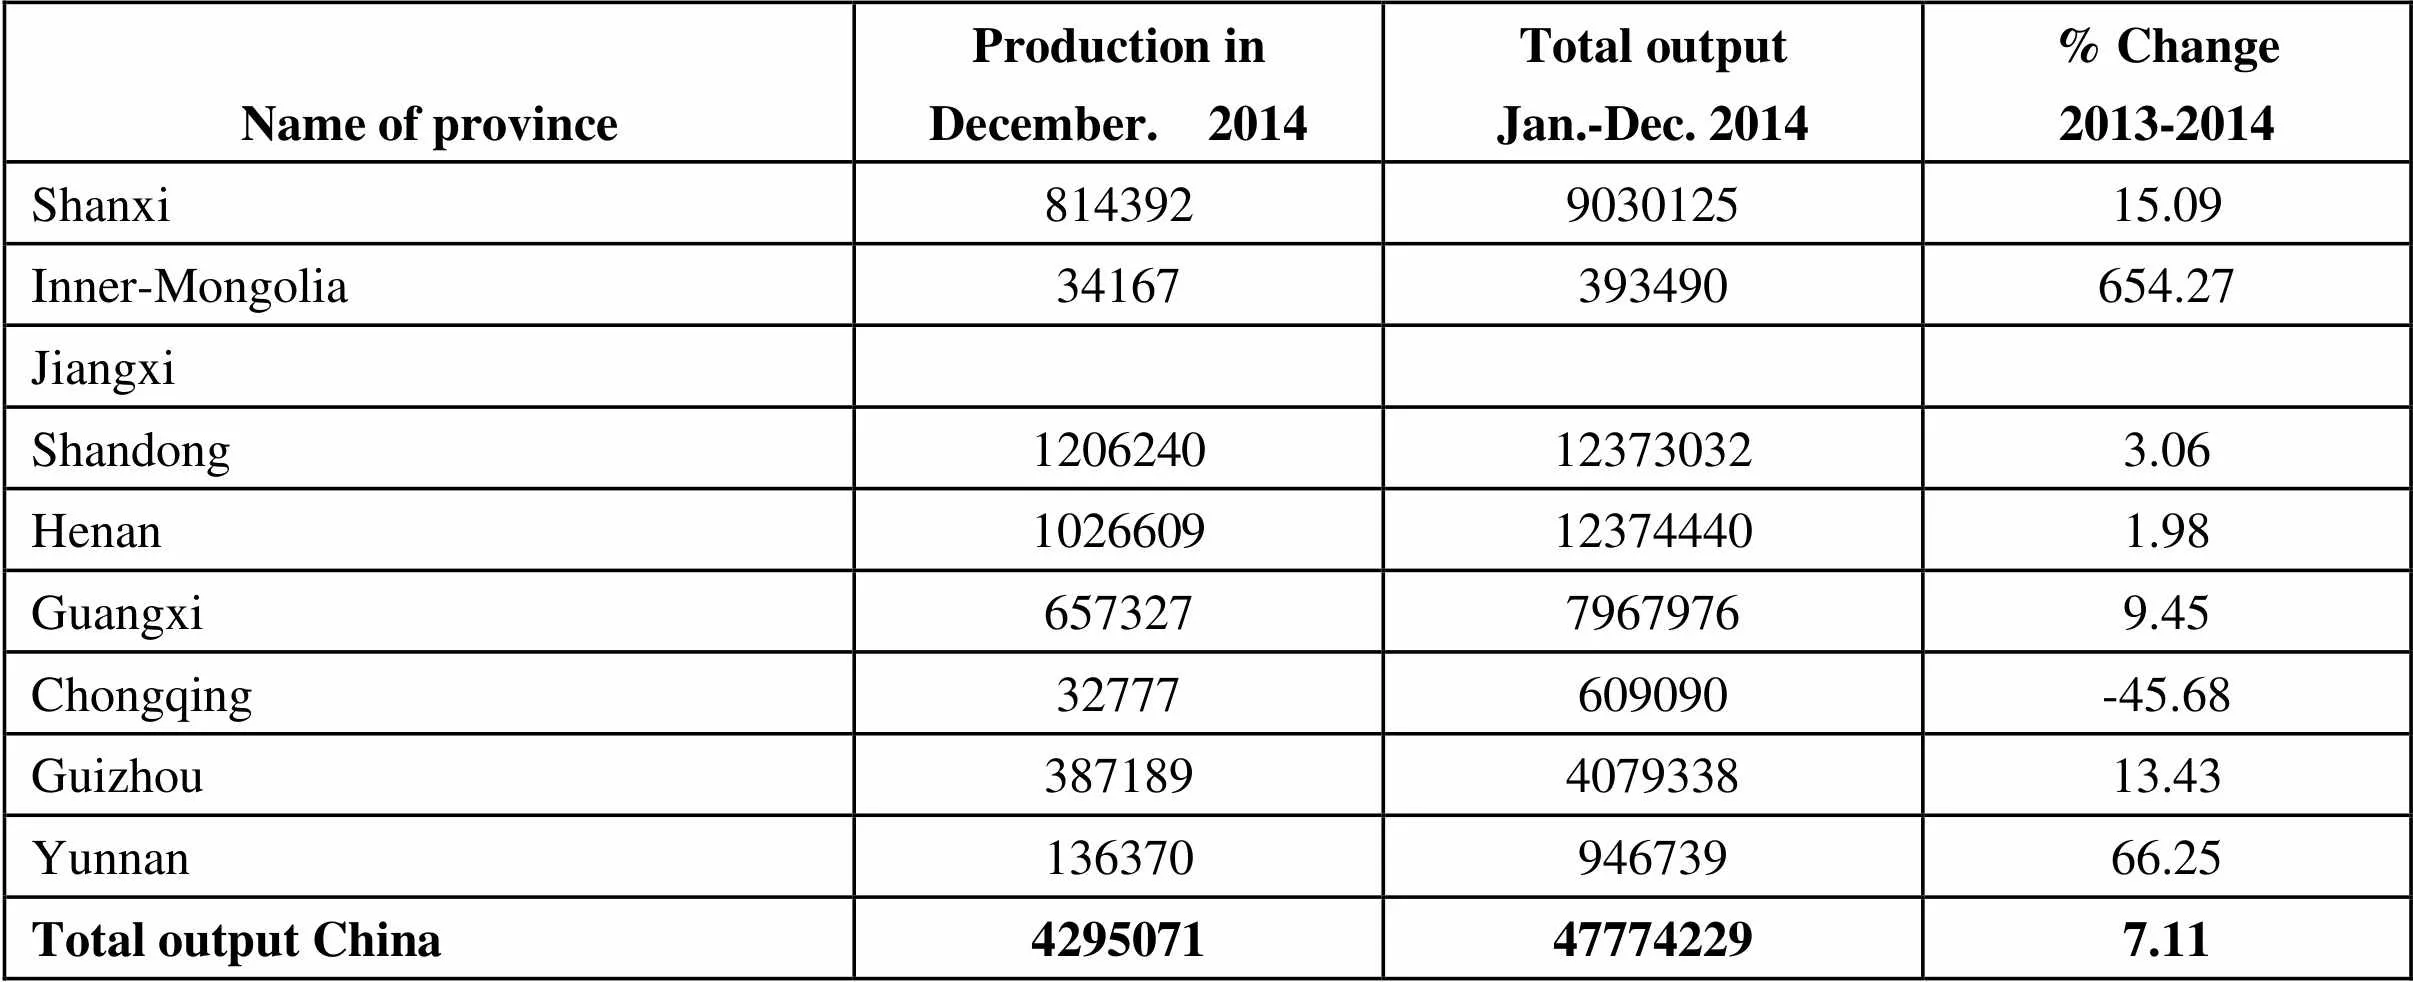
Name of province Production inDecember. 2014Total outputJan.-Dec. 2014% Change2013-2014 Shanxi814392903012515.09 Inner-Mongolia34167393490654.27 Jiangxi Shandong1206240123730323.06 Henan1026609123744401.98 Guangxi65732779679769.45 Chongqing32777609090-45.68 Guizhou387189407933813.43 Yunnan13637094673966.25 Total output China4295071477742297.11
Unit: metric ton
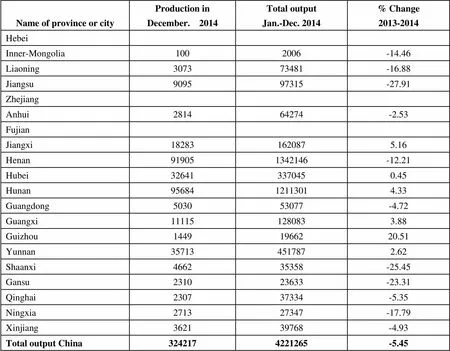
Name of province or cityProduction inDecember. 2014Total outputJan.-Dec. 2014% Change2013-2014 Hebei Inner-Mongolia 1002006-14.46 Liaoning307373481-16.88 Jiangsu909597315-27.91 Zhejiang Anhui281464274-2.53 Fujian Jiangxi182831620875.16 Henan919051342146-12.21 Hubei326413370450.45 Hunan9568412113014.33 Guangdong503053077-4.72 Guangxi111151280833.88 Guizhou14491966220.51 Yunnan357134517872.62 Shaanxi466235358-25.45 Gansu231023633-23.31 Qinghai230737334-5.35 Ningxia271327347-17.79 Xinjiang362139768-4.93 Total output China3242174221265-5.45
Unit: metric ton
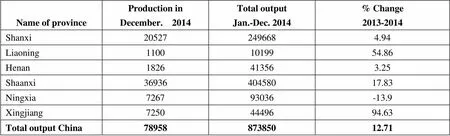
Name of provinceProduction inDecember. 2014Total outputJan.-Dec. 2014% Change2013-2014 Shanxi205272496684.94 Liaoning11001019954.86 Henan1826413563.25 Shaanxi3693640458017.83 Ningxia726793036-13.9 Xingjiang72504449694.63 Total output China7895887385012.71
Unit: metric ton
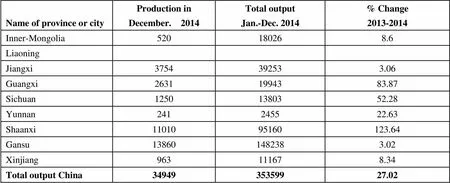
Name of province or cityProduction inDecember. 2014Total outputJan.-Dec. 2014% Change2013-2014 Inner-Mongolia520180268.6 Liaoning Jiangxi3754392533.06 Guangxi26311994383.87 Sichuan12501380352.28 Yunnan241245522.63 Shaanxi1101095160123.64 Gansu138601482383.02 Xinjiang963111678.34 Total output China3494935359927.02
Unit: metric ton
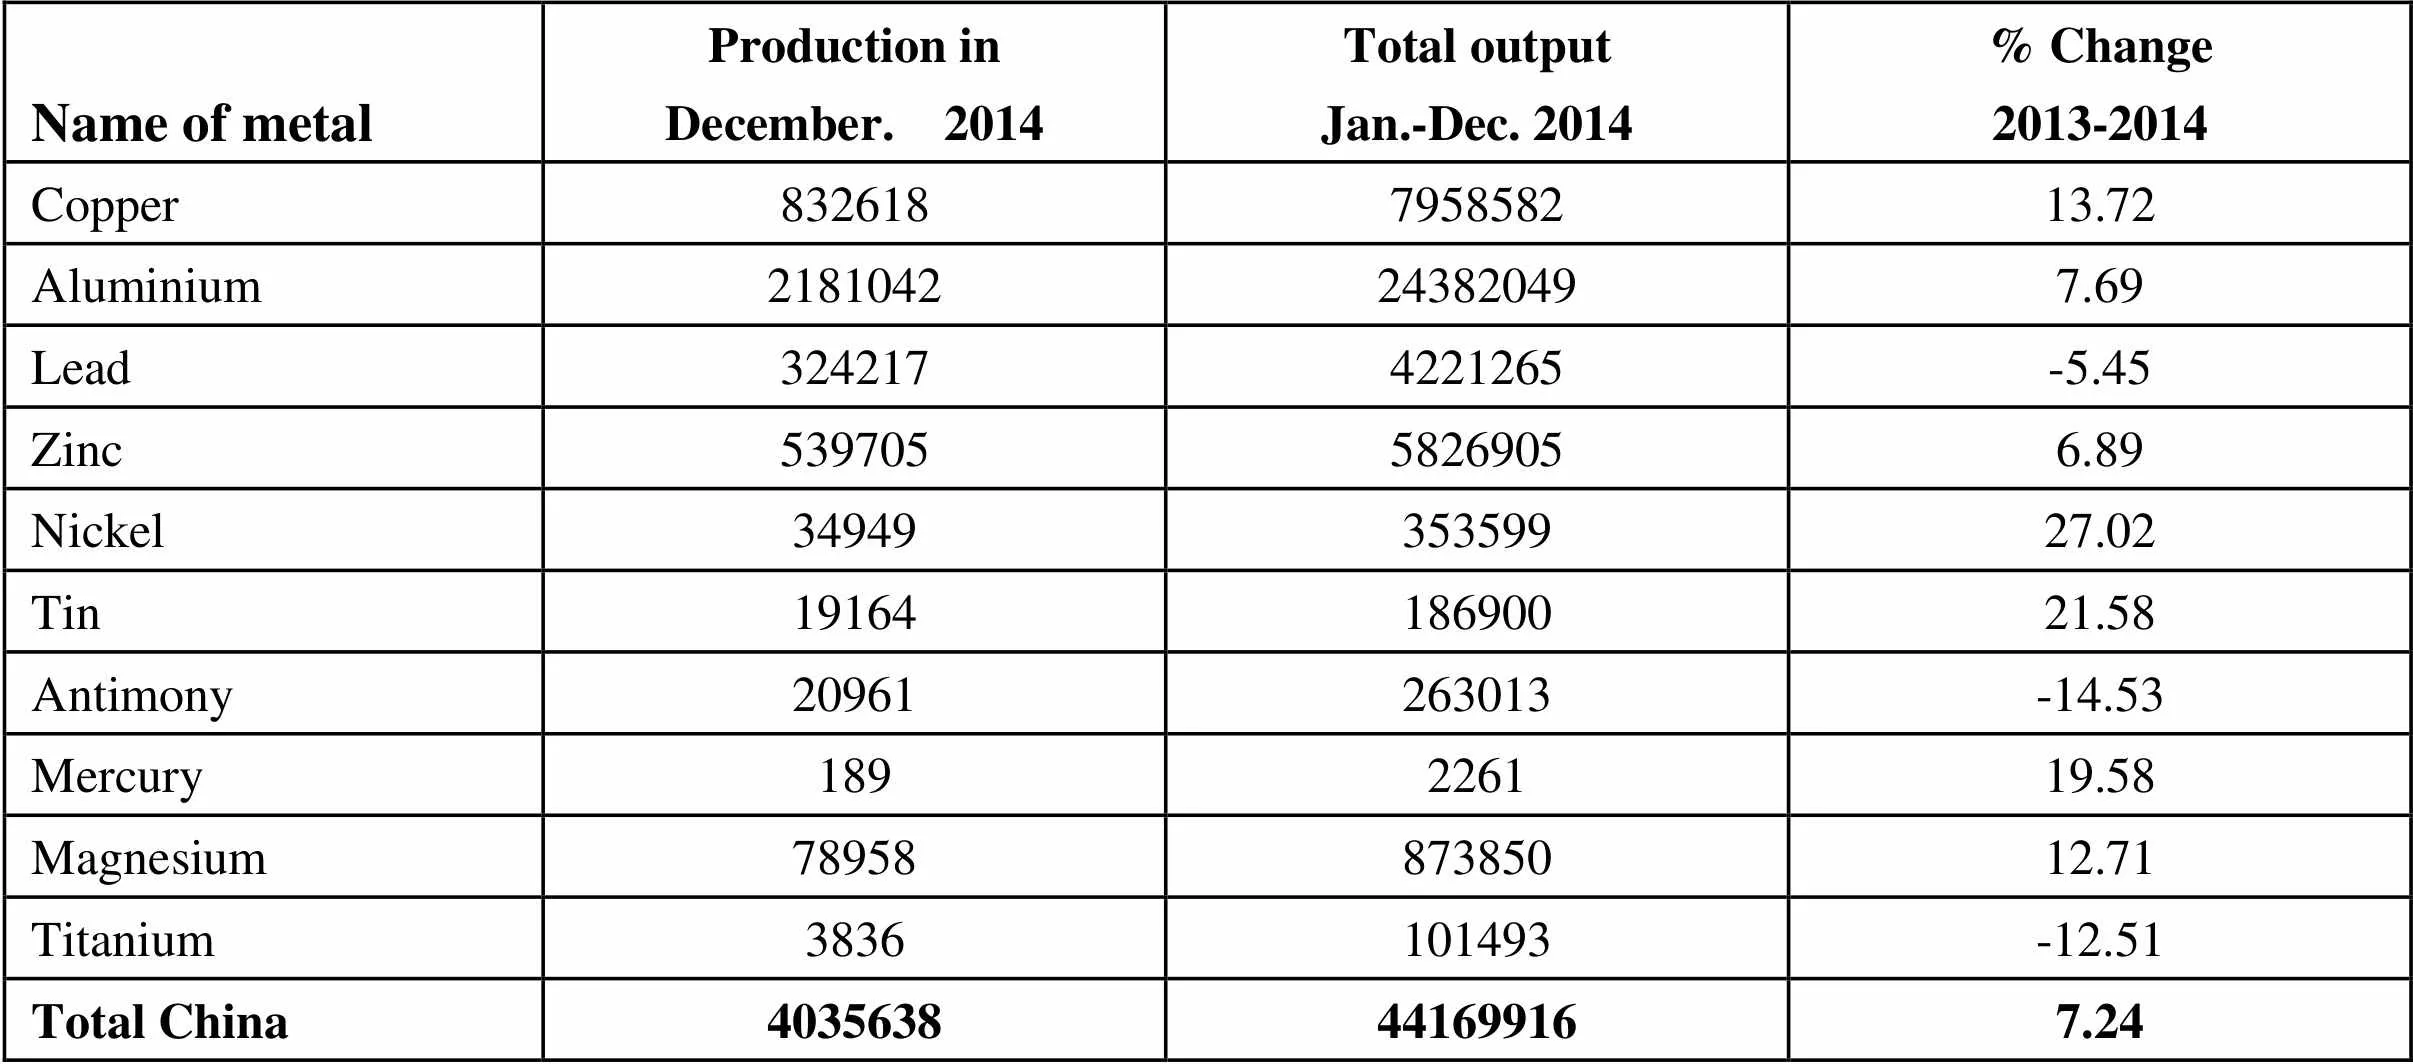
Name of metalProduction inDecember. 2014Total outputJan.-Dec. 2014% Change2013-2014 Copper832618795858213.72 Aluminium2181042243820497.69 Lead3242174221265-5.45 Zinc53970558269056.89 Nickel3494935359927.02 Tin1916418690021.58 Antimony20961263013-14.53 Mercury189226119.58 Magnesium7895887385012.71 Titanium3836101493-12.51 Total China4035638441699167.24
Unit: metric ton
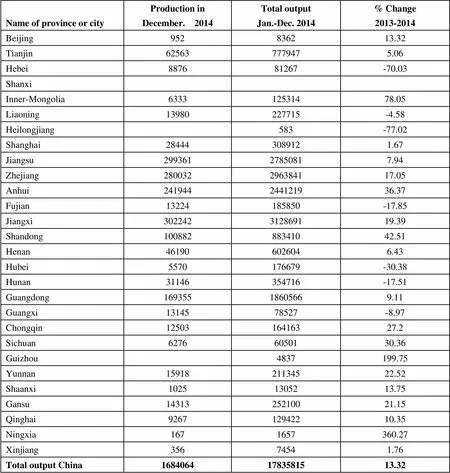
Name of province or cityProduction inDecember. 2014Total outputJan.-Dec. 2014% Change2013-2014 Beijing952836213.32 Tianjin625637779475.06 Hebei887681267-70.03 Shanxi Inner-Mongolia633312531478.05 Liaoning13980227715-4.58 Heilongjiang583-77.02 Shanghai284443089121.67 Jiangsu29936127850817.94 Zhejiang280032296384117.05 Anhui241944244121936.37 Fujian13224185850-17.85 Jiangxi302242312869119.39 Shandong10088288341042.51 Henan461906026046.43 Hubei5570176679-30.38 Hunan31146354716-17.51 Guangdong16935518605669.11 Guangxi1314578527-8.97 Chongqin1250316416327.2 Sichuan62766050130.36 Guizhou4837199.75 Yunnan1591821134522.52 Shaanxi10251305213.75 Gansu1431325210021.15 Qinghai926712942210.35 Ningxia1671657360.27 Xinjiang35674541.76 Total output China16840641783581513.32
(End of December. 2014)
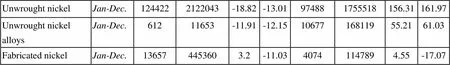
Name of commoditiesPeriodImportsExportsQuantity (metric ton)Value (thousand US dollars)% Change (2013-2014)Quantity (metric ton)Value (thousand US dollars)% Change (2013-2014)Copper:Copper concentrate (actual weight)Jan-Dec.106531361952284917.910.3282456334.0949.29Copper Scrap (actual weight)Jan-Dec.35083939979153-11.75-20.216342713-51.25-57.4Blister copperJan-Dec.5369473768604-4.48-8.61743120309811013Refined copper Jan-Dec.32747042317191813.186.532392631693741-10.82-18.59Copper alloysJan-Dec.41696235449-18.04-19.3146395-20.71-34.42Fabricated copper productsJan-Dec.5497685515476-7.29-6.446702138982774.452Aluminium:AluminaJan-Dec.4637827168035133.1531.611575110516815.4115.6Aluminium ScrapJan-Dec.20774173117120-7.92-12.18791415-29.31-35.34Primary AluminiumJan-Dec.265788533020-10.03-12.91955371971653.5-2.29Aluminium alloysJan-Dec.80316192575-19.88-14.88521237112547525.2619.69Fabricated Aluminium productsJan-Dec.45317927348342.47-1.6231761071030860112.237.24Lead:Lead concentrateJan-Dec.1642325196847020.560.2920691679-68.12-93.59Unwrought refined leadJan-Dec.207658-70.1-58.94310066552260.7354.77Unwrought refined lead alloys Jan-Dec.2616559251-9.71-8.699672628-33.07-36.55Fabricated LeadJan-Dec.981649-78.3-74.582544360757-28.57-31.84Zinc:Zinc concentrate (actual weight)Jan-Dec.187843412997005.787.39174181438631.320.77Unwrought refined ZincJan-Dec.5524761175673-1.875.2911622925622033123150Unwrought refined Zinc alloysJan-Dec.99622234726-13.37-8.2812252834-36.11-33.03Fabricated ZincJan-Dec.1349049230-8.82-4120516625649.97108.45Tin:Unwrought refined tin Jan-Dec.6648152447-46.85-45.3993721387-62.91-63.88Unwrought refined tin alloysJan-Dec.90120417-16.06-12.1737625251900Nickel:Unwrought nickel Jan-Dec.1244222122043-18.82-13.01974881755518156.31161.97Unwrought nickel alloysJan-Dec.61211653-11.91-12.151067716811955.2161.03Fabricated nickelJan-Dec.136574453603.2-11.0340741147894.55-17.07

Name of commoditiesPeriodImportsExportsQuantity (metric ton)Value (thousand US dollars)% Change (2013-2014)Quantity (metric ton)Value (thousand US dollars)% Change (2013-2014)Antimony:Unwrought antimony Jan-Dec.49492-40.4-50.0911039973-43.78-48.47Antimony oxideJan-Dec.104099341-8.83307712490007.18-8.2Molybdenum:Molybdenum concentrate (actual weight)Jan-Dec.13244137079-2.89-16.61057414631973.1977.75Ferro-molybdenumJan-Dec.4817435430.81409.7915582969137295619Molybdenum OxideJan-Dec.743156193119284816753221087.41109.3Magnesium:Unwrought magnesiumJan-Dec.6653132284917502987267985945.56-1.69Magnesium turnings, particles and powderJan-Dec.14345-2.4825.79800262140981.58-5.29Tungsten:Tungsten ore concentrateJan-Dec.592985753-37.44-31.041923016-24.2854.38Tungsten oxideJan-Dec.21770-0.6414.89873431032628.8426Ammonium Paratungstate Jan-Dec.28278965410.848.76Tungsten powderJan-Dec.58362527.436.468384137651.8343.26 Tungsten carbide powderJan-Dec.302593-44.41-28.6205810225321.0116.43 Ferro-tungstenJan-Dec.6578816.855.0843217800496437.4 Silver: (unit in kg) Unwrought silverJan-Dec.289832123484-9.57-16.1311114217376590.32-25.38 Silver powderJan-Dec.150426818700227.57-0.24348916789-8.0858.39 Semi-finished silverJan-Dec.62730696360-25.87-18.2262591959-79.33-86.41 Silver ornamentsJan-Dec.244364768318.9231.7827967983469014.455.13 Silverware Jan-Dec.1600378569.22204.681737329828431.7975.96 Gold: (unit in kg) Gold ornamentsJan-Dec.10829556867114.6499.555248304200920.0771.71 Titanium: Fabricated titaniumJan-Dec.458638070322.138.841094829113720.523.47 Titanium concentratesJan-Dec.1790677378399-14.98-36.99161891546717.06-21.16 Titanium dioxideJan-Dec.19800054094811.0311.62508738104212339.5221.16 Cobalt: Cobalt and Fabricated cobaltJan-Dec.99222606181-7.93-1.69295095348-2.025.38 Cobalt concentratesJan-Dec.1791443696875.2616.97 Cobalt oxideJan-Dec.36677057.9124.4788092054412.485.88 Cobalt nitrateJan-Dec.52957432-9.31-8.67 Cobalt carbonateJan-Dec.2740725037581284184780.743.01
Unit: metric ton
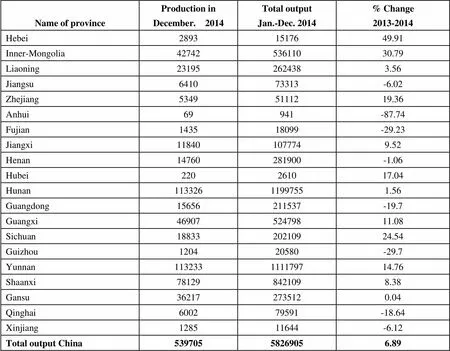
Name of provinceProduction inDecember. 2014Total outputJan.-Dec. 2014% Change2013-2014 Hebei28931517649.91 Inner-Mongolia4274253611030.79 Liaoning231952624383.56 Jiangsu641073313-6.02 Zhejiang53495111219.36 Anhui69941-87.74 Fujian143518099-29.23 Jiangxi118401077749.52 Henan14760281900-1.06 Hubei220261017.04 Hunan11332611997551.56 Guangdong15656211537-19.7 Guangxi4690752479811.08 Sichuan1883320210924.54 Guizhou120420580-29.7 Yunnan113233111179714.76 Shaanxi781298421098.38 Gansu362172735120.04 Qinghai600279591-18.64 Xinjiang128511644-6.12 Total output China53970558269056.89
 China Nonferrous Metals Monthly2015年2期
- China Nonferrous Metals Monthly的其它文章
- Chinese Aluminum Enterprises Reshuffled in Ranking in 2014
- Chengdu Strengthens Cooperation with Chinalco
- Shanxi Will Build Aluminum Deep Processing Industrial Park
- Nanshan Aluminum Reached Strategic Cooperation with CSR Corporation Limited
- Shandong Plans to Cultivate Two Aluminum Industry Groups with Sales Income Topping 100 billion yuan Within Three Years
- Shaanxi Nonferrous Metal’s Operating Revenue Topped 100 Billion Yuan, up by 13.18% on Y-o-Y Basis