Palaeogeography of a shallow carbonate platform: The case of the Middle to Late Oxfordian in the Swiss Jura Mountains
André Strasser *, Bernard Pittet, Wolfgang Hug
a Department of Geosciences, University of Fribourg, Chemin du Musée 6, 1700 Fribourg,Switzerland
b Université Lyon 1, UMR CNRS LGLTPE 5276, Campus Doua, Batiment Géode, 69622 Villeur?banne, France
c Paléontologie A16, Section d’archéologie et paléontologie, Office de la culture, H?tel des Halles, 2900 Porrentruy, Switzerland
KEYWORDS Swiss Jura,Oxfordian,carbonate platform,facies evolution,sequence stratigraphy,cyclostratigraphy
Abstract The Oxfordian (Late Jurassic) carbonate-dominated platform outcropping in the Swiss Jura Mountains offers a good biostratigraphic, sequence-stratigraphic, and cyclostratigraphic framework to reconstruct changes in facies distribution at a time-resolution of 100 ka. It thus allows interpreting the dynamic evolution of this platform in much more detail than conventional palaeogeographic maps permit. As an example, a Middle to Late Oxfordian time slice is presented, spanning an interval of about 1.6 Ma. The study is based on 12 sections logged at cm-scale. The interpreted depositional environments include marginal-marine emerged lands, fresh-water lakes, tidal flats, shallow lagoons, ooid shoals, and coral reefs.Although limestones dominate, marly intervals and dolomites occur sporadically.
Major facies shifts are related to m-scale sea-level changes linked to the orbital short eccentricity cycle (100 ka). The 20-ka precession cycle caused minor facies changes but cannot always be resolved. Synsedimentary tectonics induced additional accommodation changes by creating shallow basins where clays accumulated or highs on which shoals or islands formed.Autocyclic processes such as lateral migration of ooid and bioclastic shoals added to the sedimentary record. Climate changes intervened to control terrestrial run-off and, consequently,siliciclastic and nutrient input. Coral reefs reacted to such input by becoming dominated by microbialites and eventually by being smothered. Concomitant occurrence of siliciclastics and dolomite in certain intervals further suggests that, at times, it was relatively arid in the study area but there was rainfall in more northern latitudes, eroding the Hercynian substrate.
These examples from the Swiss Jura demonstrate the highly dynamic and (geologically speaking) rapid evolution of sedimentary systems, in which tectonically controlled basin morphology, orbitally induced climate and sea-level changes, currents, and the ecology of the carbonate-producing organisms interacted to form the observed stratigraphic record. However,the interpretations have to be treated with caution because the km-wide spacing between the studied sections is too large to monitor the small-scale facies mosaics as they can be observed on modern platforms and as they certainly also occurred in the past.
1 Introduction
Palaeogeographic maps based on plate-tectonic reconstructions and covering large areas (e.g., Blakey, 2014; Scotese, 2014; Stampfli and Borel, 2002; Stampfli et al., 2013)are very useful to visualize the general context in which a study area evolved. However, coastlines and facies distributions then are often presented time-averaged over millionyear long time intervals (e.g., Dercourt et al., 1993). In the case of shallow carbonate platforms where facies patterns change rapidly through time as well as through space (facies mosaics; e.g., Rankey and Reeder, 2010; Wilkinson and Drummond, 2004), it is useful to search for a more detailed picture of palaeogeography.
The goal of this study is to present a series of maps that monitor the facies evolution of an ancient carbonate platform in (geologically speaking) narrow time-steps. As an example, a time interval in the Oxfordian (Late Jurassic) of the Swiss Jura Mountains is chosen. The controlling mechanisms of facies distribution in time and in space will be discussed, and the potential and limitations of such an approach to palaeogeography will be evaluated.
2 Palaeogeographic and stratigraphic setting
In Middle to Late Oxfordian times, a wide, carbonatedominated shelf covered the realm of today’s Jura Mountains (Fig. 1). It was structured by differential subsidence along faults inherited from older lineaments (Wetzel et al.,1993; Wetzel and Allia, 2000). To the north, very shallow depositional environments predominated, whereas to the south deeper epicontinental basins developed. Siliciclastic material was furnished episodically by the erosion of Hercynian crystalline massifs in the hinterland. The study area was situated at a palaeolatitude estimated between 33°N and 38°N (Barron et al., 1981; Dercourt et al., 1993; Smith et al., 1994).
Lithostratigraphy and facies of the Oxfordian in the Swiss Jura Mountains have been studied extensively by,e.g., Ziegler (1956, 1962), Gygi (1969, 1992), and Bolliger and Burri (1970). The biostratigraphy based on ammonites was established mainly by Gygi (1995, including summary of earlier work). Gygi and Persoz (1986) used bio- and mineral stratigraphy to reconstruct the platform-to-basin transition. A correlation with the French Jura was established by Enay et al. (1988); a sequence-stratigraphic interpretation has been proposed by Gygi et al. (1998). Selected intervals calibrated by high-resolution sequence stratigraphy and cyclostratigraphy have been analyzed and interpreted by Pittet (1996), Dupraz (1999), Hug (2003), Védrine (2007),and Stienne (2010). Jank et al. (2006) presented a comprehensive view of Late Oxfordian to Kimmeridgian stratigraphy and palaeogeography. The formation of platform and basin facies in space and time and their relationship to synsedimentry tectonics was analyzed in detail by Allenbach (2001).
The terminology of formations and members and their biostratigraphic attribution follow Gygi (1995, 2000; Fig.2). The major sequence boundaries are labeled according to Hardenbol et al. (1998), and the numerical ages are based on Gradstein et al. (1995). Although a more recent geological time-scale is available (International Commission on Stratigraphy, 2014), we use the older one because the ages of ammonite zones and sequence boundaries in the chart of Hardenbol et al. (1998) are interpolated using the numbers of Gradstein et al. (1995).
3 Methods
The sections presented here (Fig. 3 and Table 1) have been logged at cm-scale. Dense sampling guaranteed that even minor facies changes were detected. Thin-sections were prepared for the rock samples; marls were washed and the residue picked for microfossils. Under the optical microscope or the binocular, microfacies have been analyzed using the Dunham (1962) classification for carbonate rocks and a semi-quantitative estimation of the abundance of rock constituents (Fig. 4). Special attention has been paid to sedimentary structures and to omission surfaces (cf.Clari et al.,1995; Hillg?rtner, 1998). The sum of this sedimentological information was then used to interpret the depositional environments. For the sequence-stratigraphic interpretation of the facies evolution, the nomenclature of Vail et al. (1991) was applied. Vertical facies changes define deepening-shallowing depositional sequences, which are hierarchically stacked (example in Fig. 4).
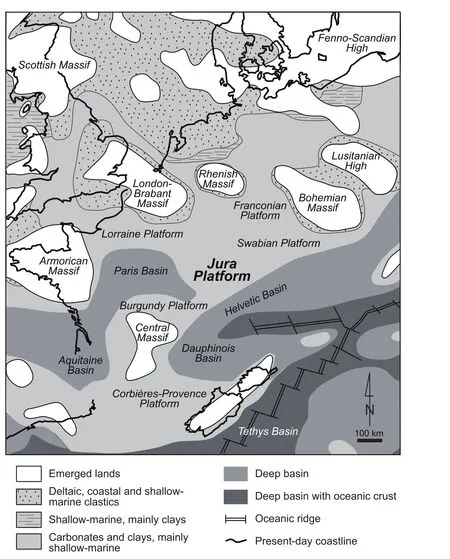
Figure 1 Palaeogeographic setting of the Jura Platform during the Oxfordian. Modified from Carpentier et al. (2006), based on Enay et al. (1980), Ziegler (1988), and Thierry (2000).
Elementary sequences are the smallest units where facies evolution indicates a cycle of environmental change,including sea-level change (Strasser et al., 1999). In some cases, there is no facies evolution discernable within a bed but marls or omission surfaces delimiting the bed suggest an environmental change (Strasser and Hillg?rtner, 1998).Commonly, 2 to 7 elementary sequences compose a smallscale sequence, which generally displays a deepening then shallowing trend and exhibits the relatively shallowest facies at its boundaries (Fig. 4). For example, birdseyes, microbial mats, or penecontemporaneous dolomitization suggest tidal-flat environments, keystone vugs in grainstones point to a beach, and detrital quartz grains and plant fragments indicate input from the hinterland during low relative sea level (late highstand and/or early transgressive conditions; Pittet and Strasser, 1998). In the studied sections it is common that four small-scale sequences make up a medium-scale sequence, which again displays a general deeping-shallowing trend of facies evolution and the relatively shallowest facies at its boundaries. Furthermore,the elementary sequences commonly are thinner around the small-scale and medium-scale sequence boundaries,which suggests reduced accommodation. Thick elementary sequences in the central parts of these sequences imply higher accommodation.
Based on these interpretations, and within the biostratigraphic and sequence-stratigraphic framework (Fig. 2), the studied sections have been correlated at the scale of the small-scale sequences (Fig. 5; Strasser, 2007). Although this correlation includes uncertainties as to where exactly place some small-scale sequence boundaries, it nevertheless offers the basis for a general palaeogeographic interpretation with a relatively high time resolution. The dominant facies category has been interpreted for each deepening-upward(transgressive) and each shallowing-upward (regressive)part of each small-scale sequence (dominant meaning that over 50% of the non-decompacted facies thickness encountered in one part can be attributed to that category).
4 Facies and depositional environments
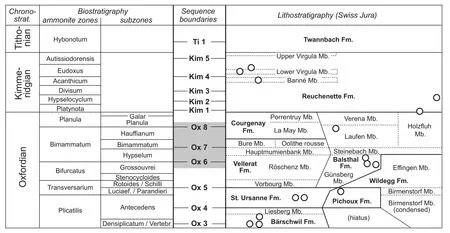
Figure 2 Chronostratigraphy, biostratigraphy, and lithostratigraphy of the study area. Litho- and biostratigraphic scheme after Gygi(1995, 2000), with circles indicating where biostratigraphically significant ammonites have been found. Sequence boundaries after Hardenbol et al. (1998) and Gygi et al. (1998). Studied interval in grey. Fm.: Formation; Mb.: Member.
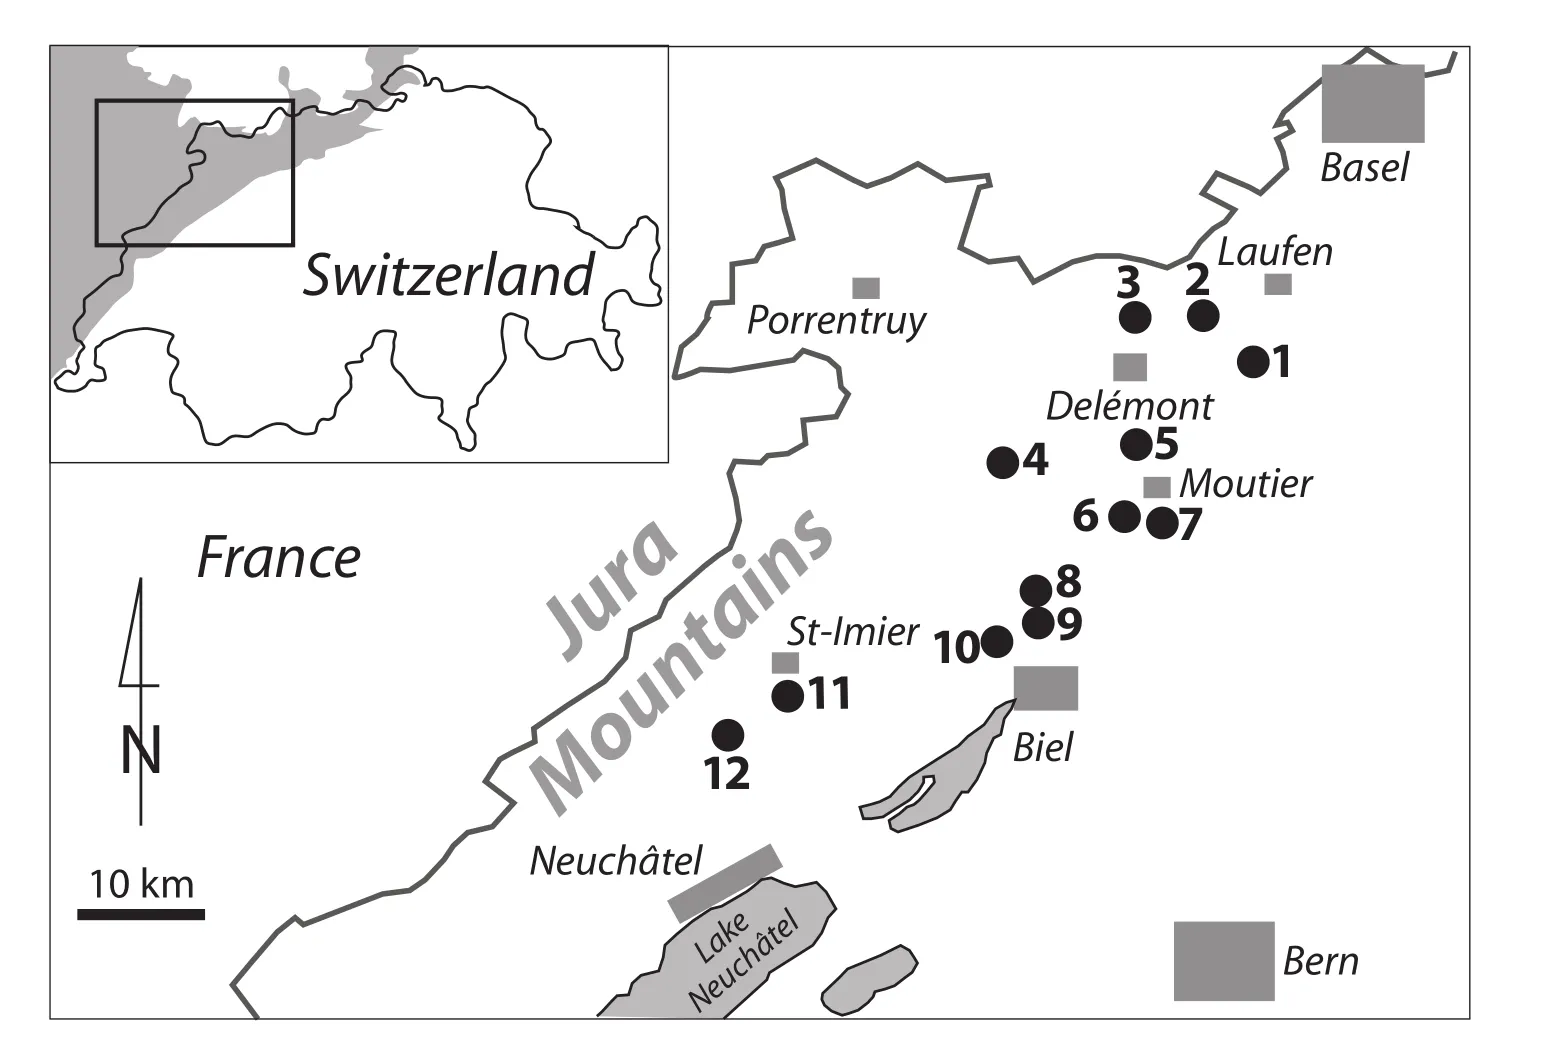
Figure 3 Locations of the studied sections in the Swiss Jura. Inset: Jura Mountains in grey.
The detailed analysis of the microfacies encountered in the studied sections and the interpretation of the depositional environments has been performed by Pittet (1996), Dupraz (1999), Gsponer (1999), Jordan (1999), Rauber (2001),and Hug (2003). Lateral facies changes over short distances and vertical changes over short time intervals are common.For example, Samankassou et al. (2003) illustrated a close juxtaposition of coral reefs and ooid shoals in the Steinebach Member, and Védrine and Strasser (2009) looked into the distribution of corals, ooids, and oncoids in the Hauptmumienbank and Steinebach members with a time resolution of 20 ka. For the purpose of the present paper, however, only a very general view of facies is presented, which filters out the local facies changes and permits to illustrate the general palaeogeographical evolution of the study area.
The Dunham (1962) classification, typical grains and fossils, and sedimentary structures are used to interpret the depositional environment in terms of water depth, water energy, and ecological conditions (e.g., oxygenation, nutrients, substrate). The so defined environments are groupedinto larger categories that characterized the Oxfordian carbonate platform: (1) emerged land, lake, and beach, (2)tidal flat, (3) restricted lagoon (in terms of reduced energy and/or oxygenation), (4) open lagoon, (5) ooid shoal, and(6) coral reef. Furthermore, significant terrigenous input(siliciclastics and/or plant material) and dolomitization are distinguished. A summary of the facies characteristics of these categories is given in Table 2.
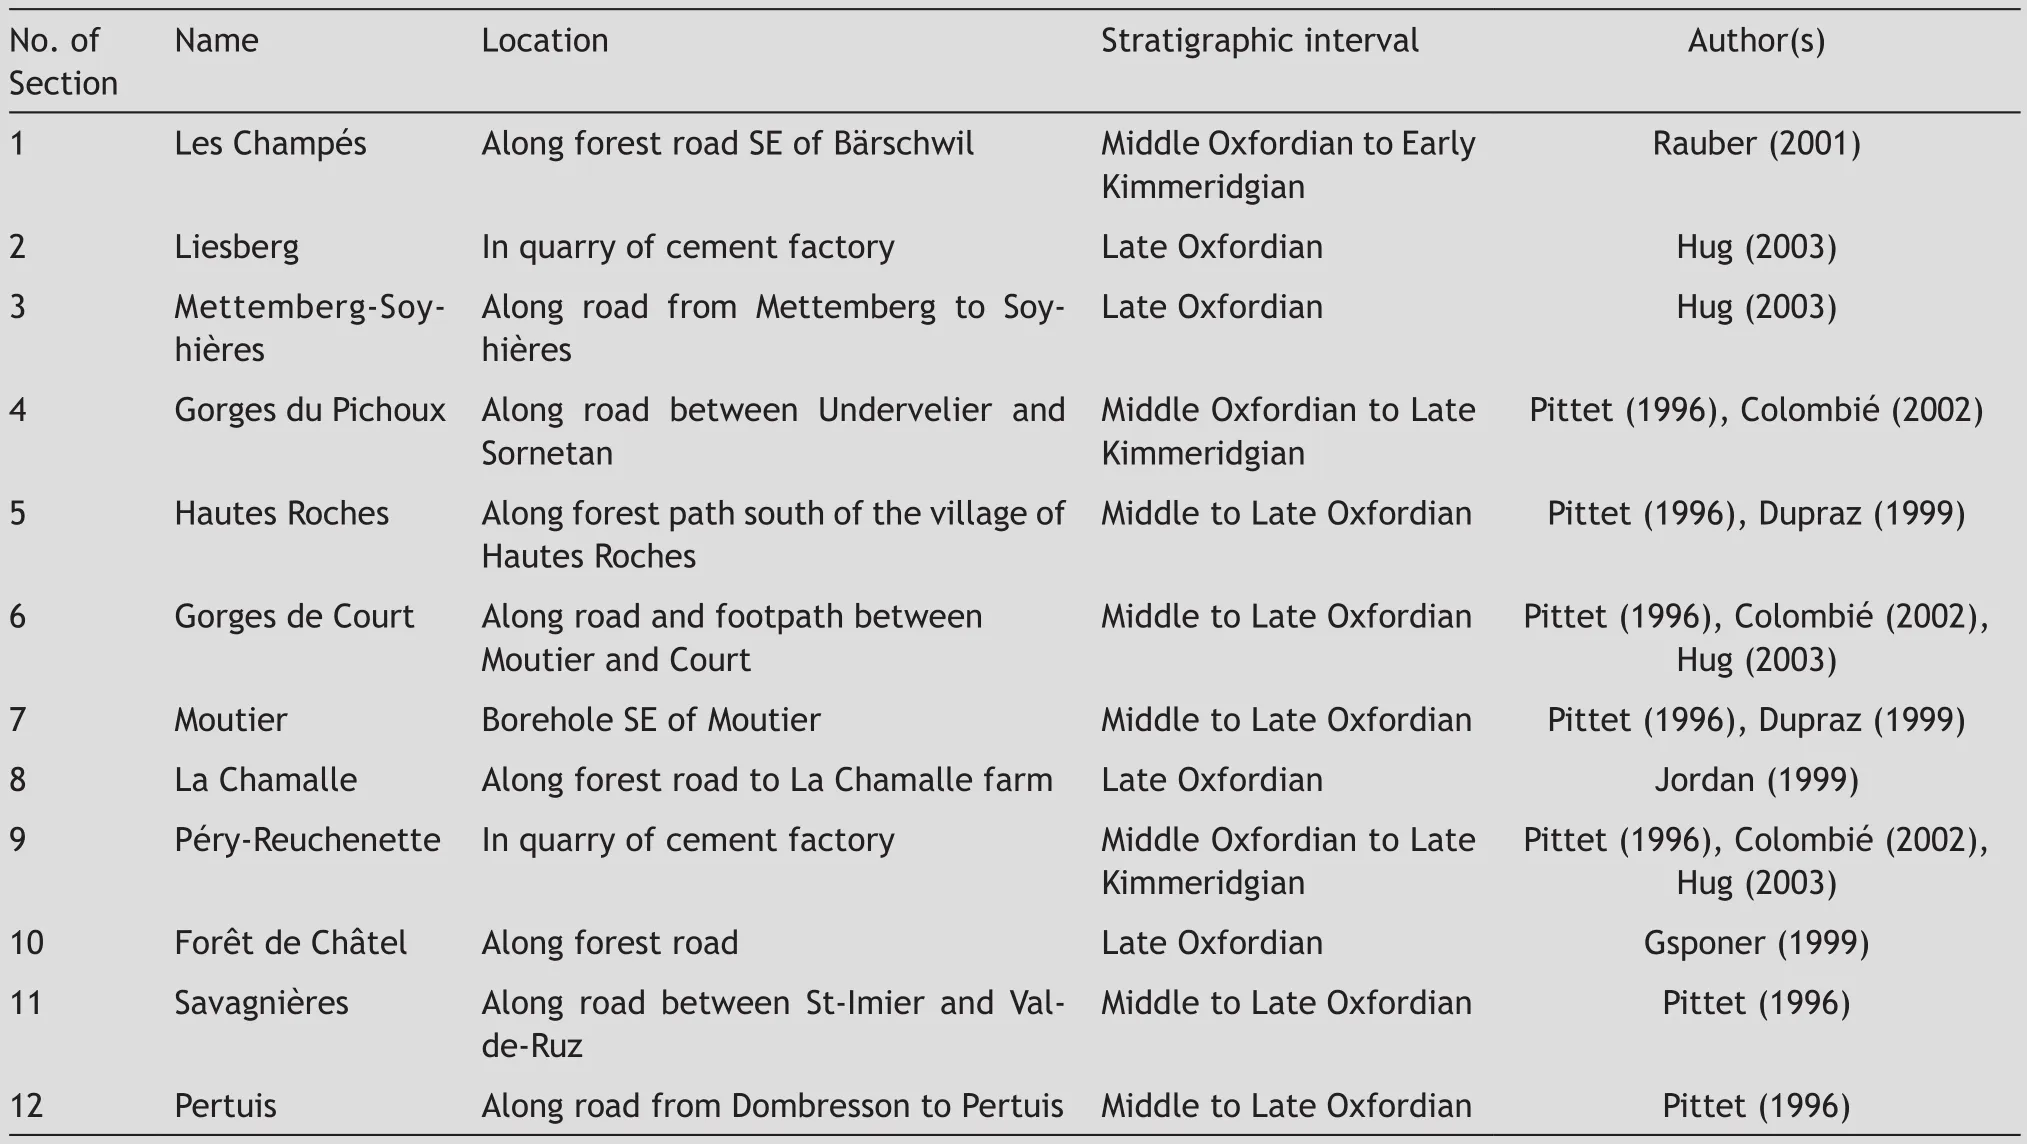
Table 1 Locations, stratigraphic intervals, and studies of the sections used in the present contribution
5 Depositional sequences and their timing
The fact that most of the small-scale and medium-scale sequence boundaries can be followed over hundreds of kilometers points to an allocyclic (i.e. external) control on sequence formation. However, also autocyclic processes (such as lateral migration of sediment bodies or reactivation of high-energy shoals) occurred and are recorded mainly on the level of the elementary sequences (Hill et al., 2012;Strasser, 1991; Strasser and Védrine, 2009).
Based on the lithostratigraphic and biostratigraphic frame furnished by Gygi and Persoz (1986) and Gygi (1995),and on the detailed analyses of stacking pattern and facies evolution, a sequence-stratigraphic and cyclostratigraphic interpretation can be proposed for each studied section. However, superposition of higher-frequency sealevel fluctuations on a long-term trend of sea-level change led to repetition of diagnostic surfaces, defining sequenceboundary zones (Monta?ez and Osleger, 1993; Strasser et al., 1999). Fast rise of sea level either caused distinct maximum-flooding surfaces (which again may be repeated defining a maximum-flooding zone), or is recorded by the relatively deepest or most open-marine facies. Major transgressive surfaces generally correlate well from one section to another. The correlation of small-scale sequences is relatively straightforward, although the exact emplacement of their sequence boundaries may be difficult to judge when the elementary sequences are not well defined.
Comparing the interpretation of the studied sections with the sequence stratigraphy of Hardenbol et al. (1998) established in European basins, and based on the stratigraphic scheme presented in Figure 2, the large-scale sequence boundaries Ox 6, Ox 7, and Ox 8 can easily be identified.The numerical ages attributed by Hardenbol et al. (1998)to these sequence boundaries allow estimating the duration of the small- and medium-scale sequences identified in the studied outcrops, assuming that each sequence of a given order had the same duration. Ox 6 is dated at 155.8 Ma, Ox 8 at 154.6 Ma (Hardenbol et al., 1998). Three medium-scale and 12 small-scale sequences are counted between these sequence boundaries (Fig. 5). It thus can be assumed that a small-scale sequence lasted about 100 ka, and a mediumscale sequence about 400 ka. A best-fit correlation for the Middle Oxfordian to Late Kimmeridgian interval has been proposed by Strasser (2007), which confirms this interpretation. Consequently, it can be concluded that the formation of the observed, hierarchically stacked depositional sequences was at least partly controlled by sea-level changes,which themselves were controlled by climatic changes, and these were induced by orbitally-induced insolation changes.Thus, the small-scale sequences correspond to the short eccentricity cycle of 100 ka, and the medium-scale sequences to the long eccentricity cycle of 400 ka.
Where 5 elementary sequences compose a small-scale one, it can be assumed that also the 20-ka precessional cycle is recorded. However, in many cases the facies evolution within an elementary sequence does not allow demonstrating that it was created by a sea-level cycle (and thus related to an orbital cycle): autocyclic processes may have overprinted the allocyclic signal.
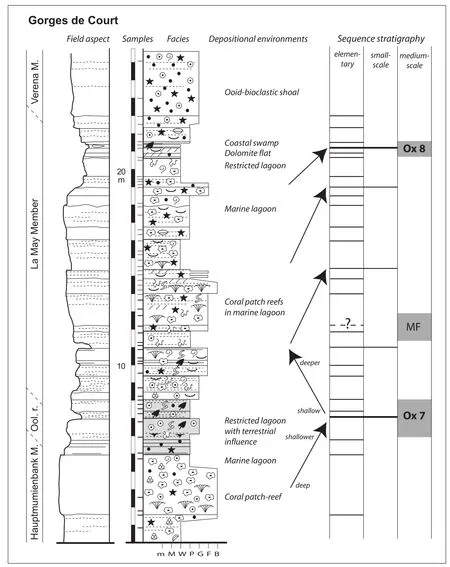
Figure 4 Deepening-shallowing trends of facies evolution, and sequence- and cyclostratigraphic interpretation of a part of the Gorges de Court section (number 6 in Fig. 3). Legend of facies symbols in Figure 5. MF: maximum-flooding interval. Ool. r.: Oolithe rousse Member.
6 Palinspastic reconstruction of the platform
The study area lies in the fold-and-thrust belt of the Jura Mountains, which formed during the Late Miocene to Early Pliocene. In order to represent the palaeo-distances between the studied sections, a palinspastic reconstruction has been performed. The tectonic structure is complex with broken anticlines and thrust folds, which in the study area generally strike NNE-SSW (Hindle and Burkhard,1999; Mosar, 1999). Based on the restored cross-sections published by Bitterli (1990), a N-S elongation factor of 1.5 to 2 is assumed when compared to today’s geographic posi-tion of the sections (Figs 3 and 7). The folds and thrusts are cross-cut by numerous faults, which were mainly inherited from the Paleogene rifting in the Upper Rhine Graben (Ustaszewski and Schmid, 2006). However, the N-S displacement along these faults is negligible in the study area.
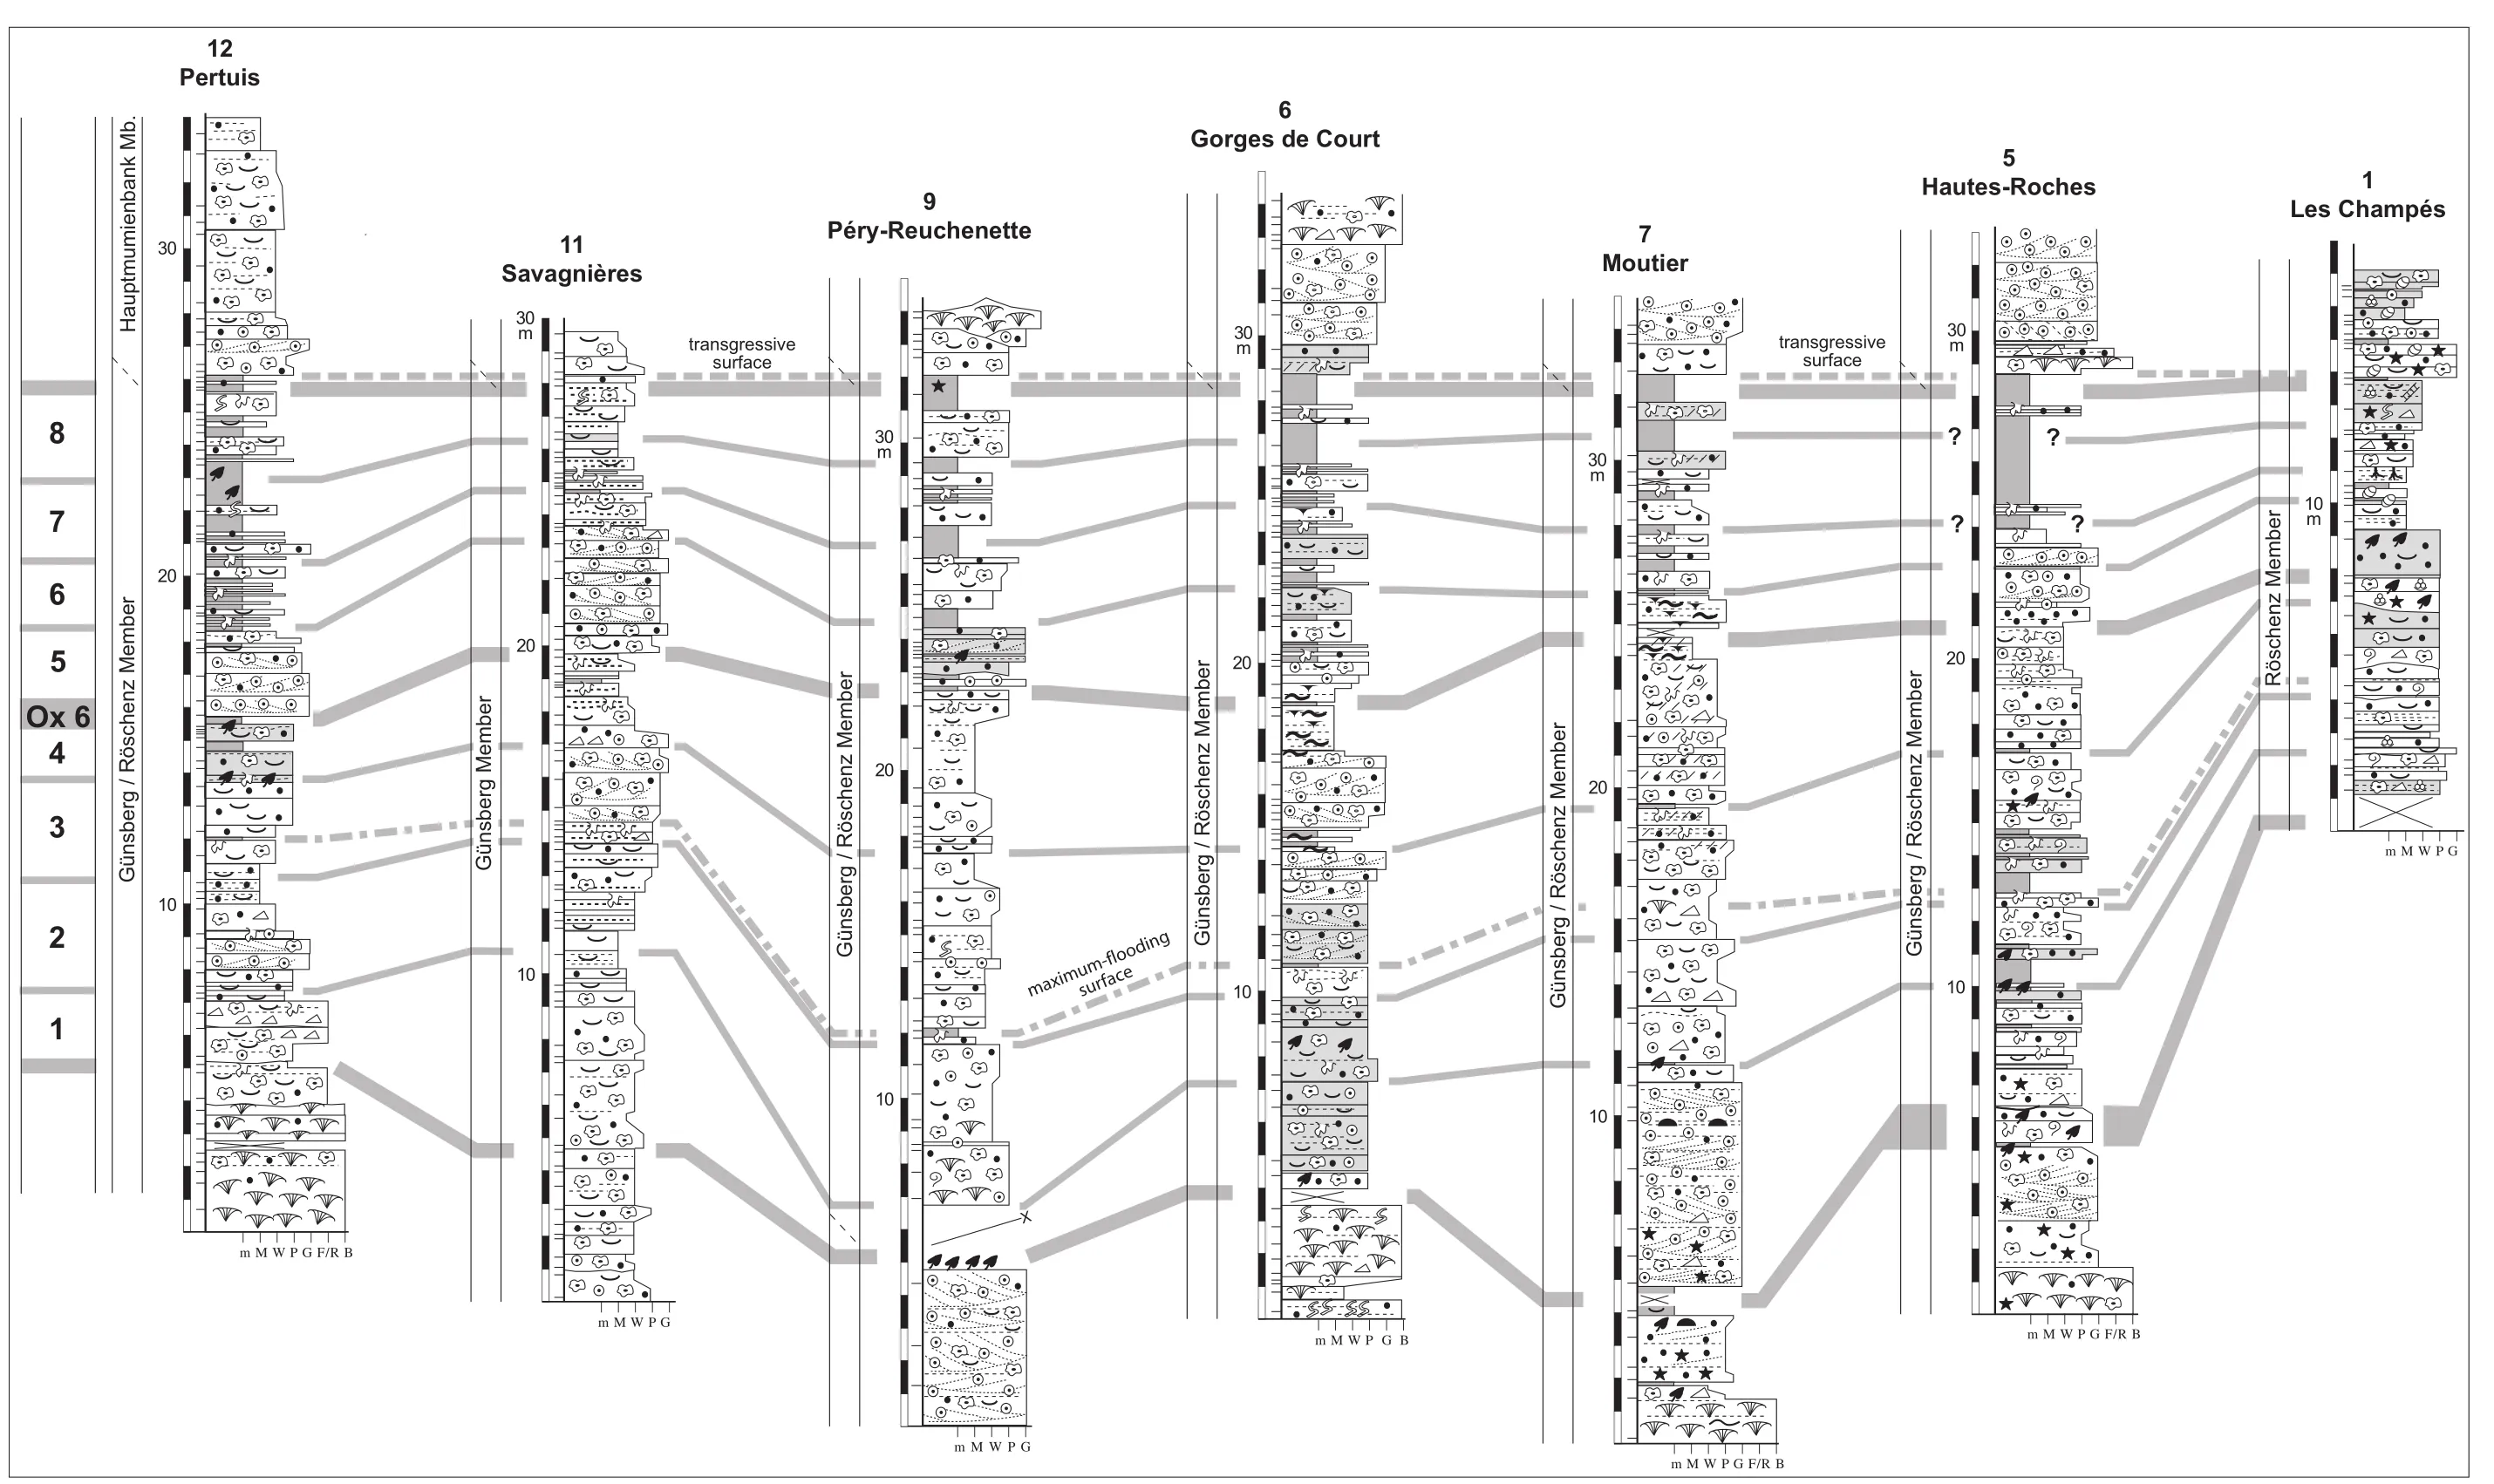
Figure 5 Correlationof small-scalesequences (numberedonthe left) betweenthe studiedsections.
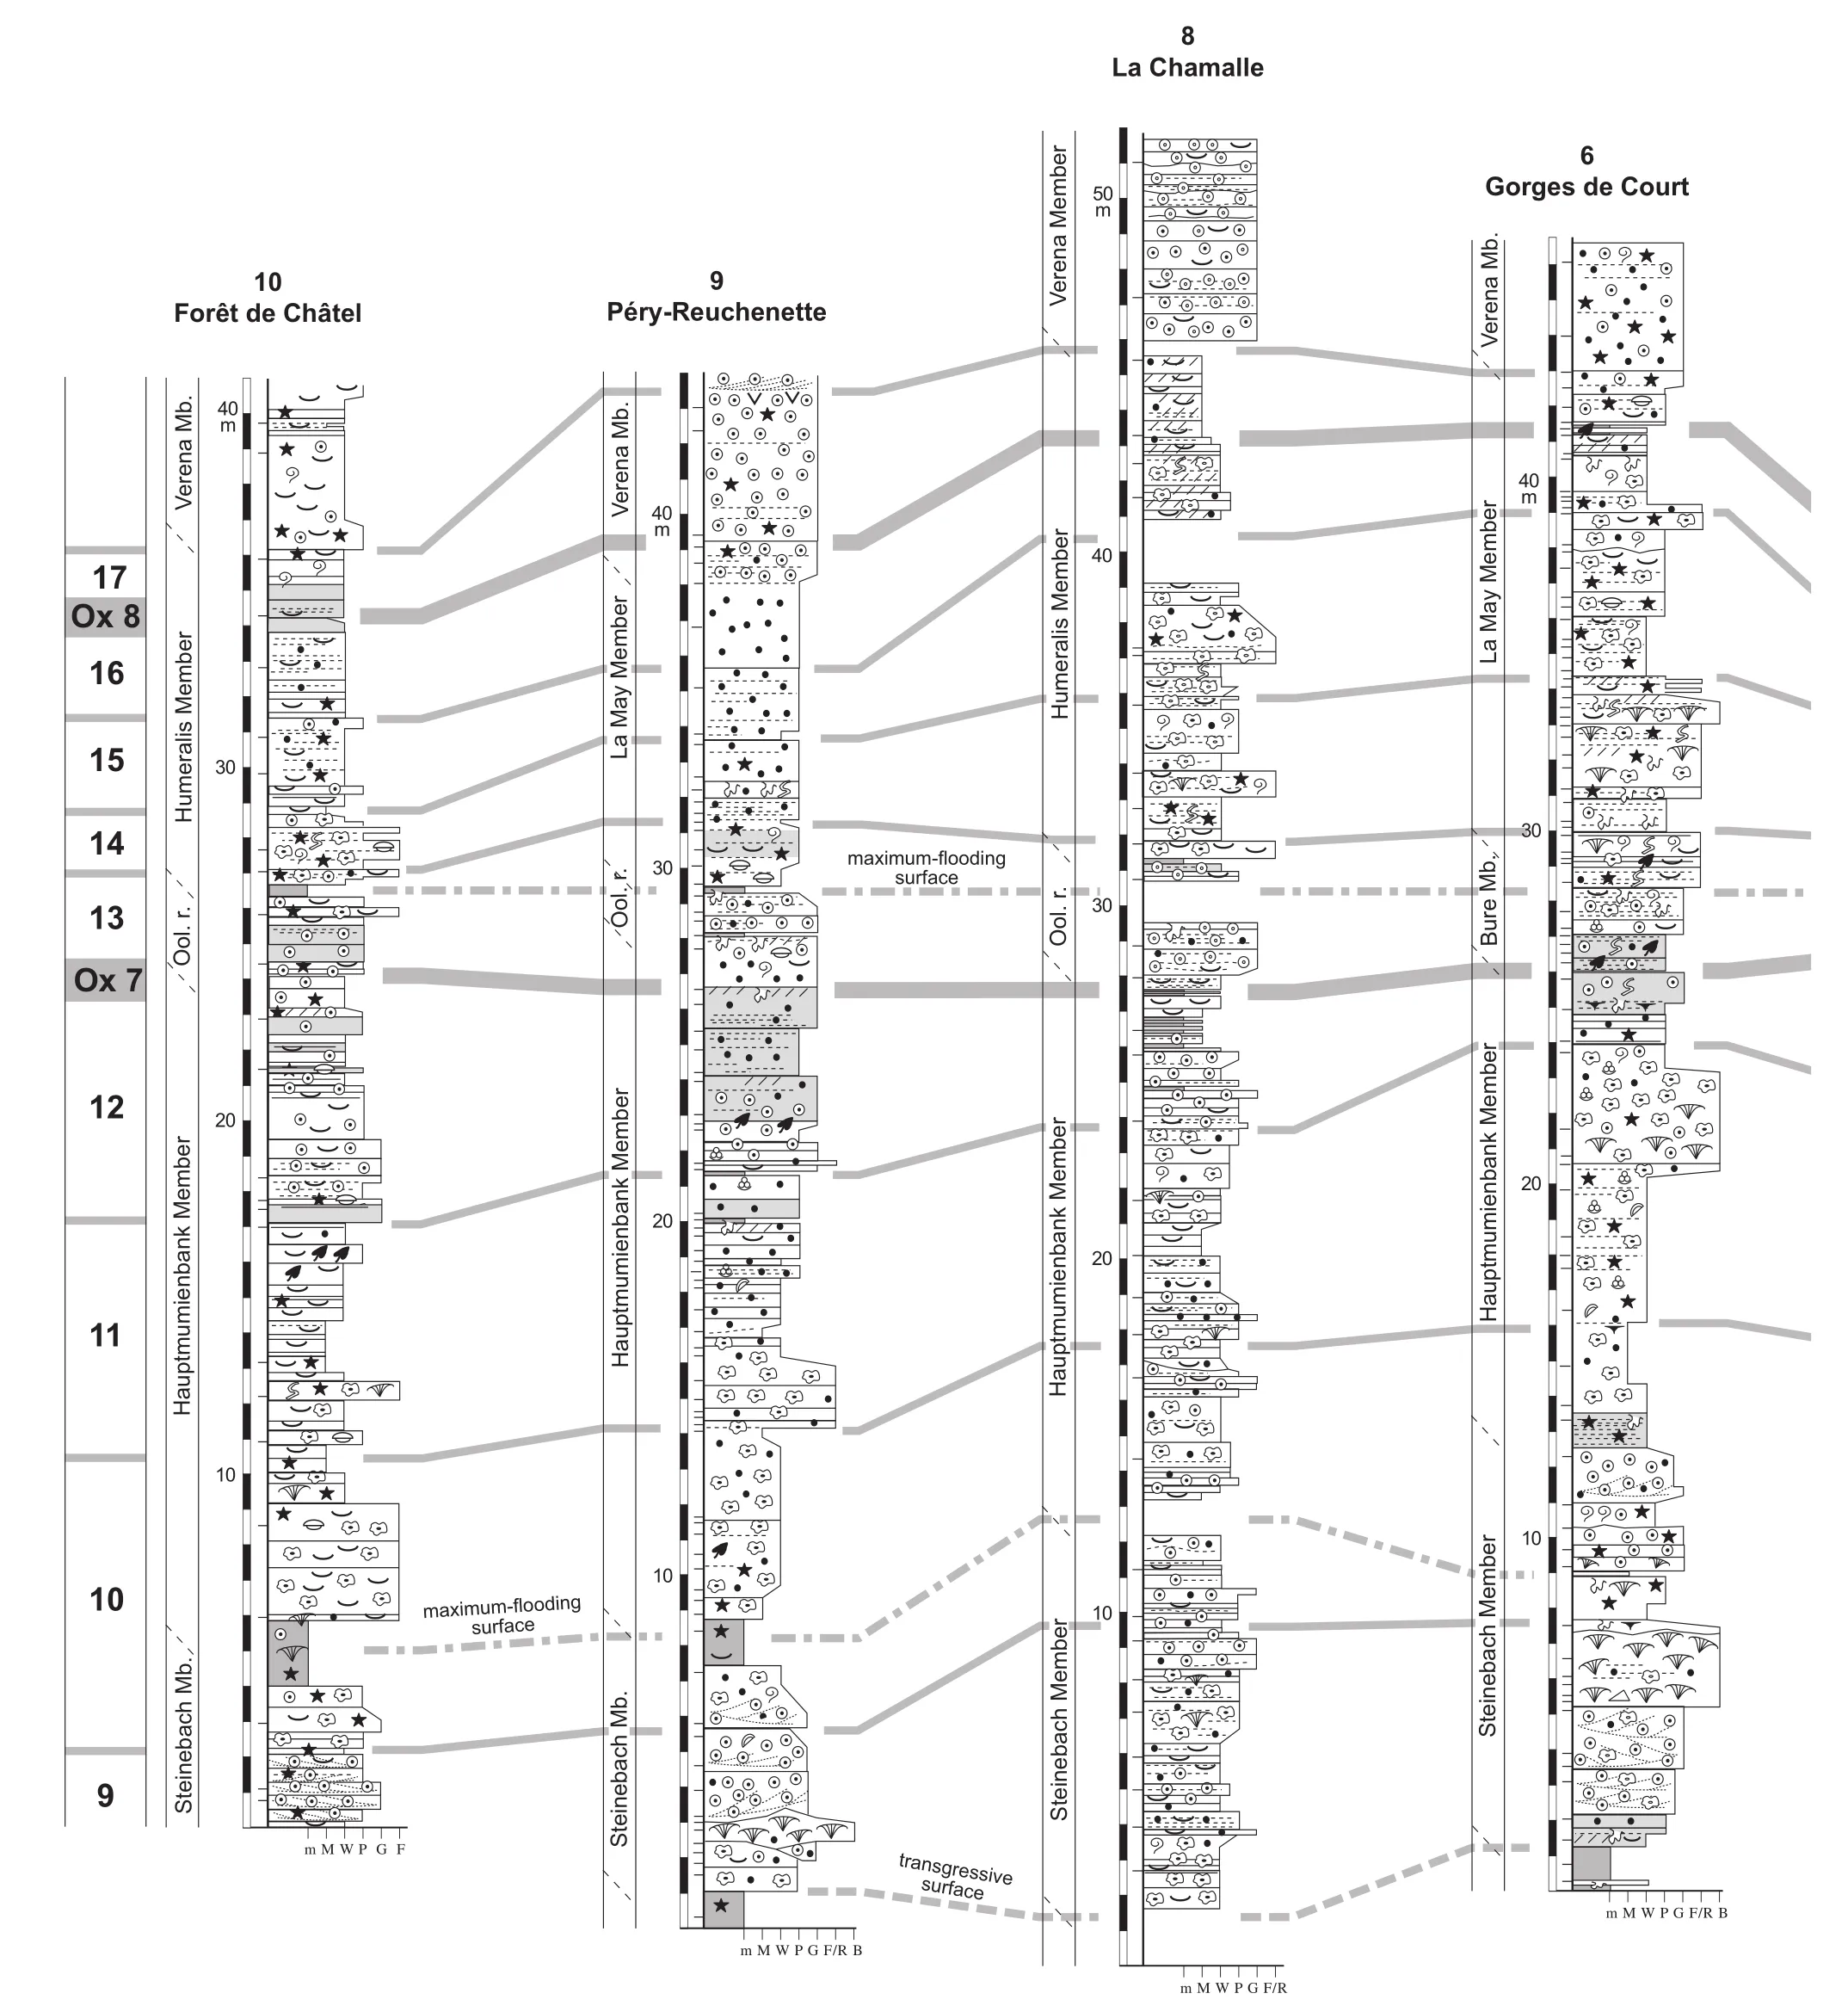
Figure 5, continued.
The palinspastic map thus established serves as the base for the facies maps presented in chapter 7. Even if there are many uncertainties about the true palaeo-distances between the sections, their positions relative to each other are preserved.
7 Dynamic evolution of the platform
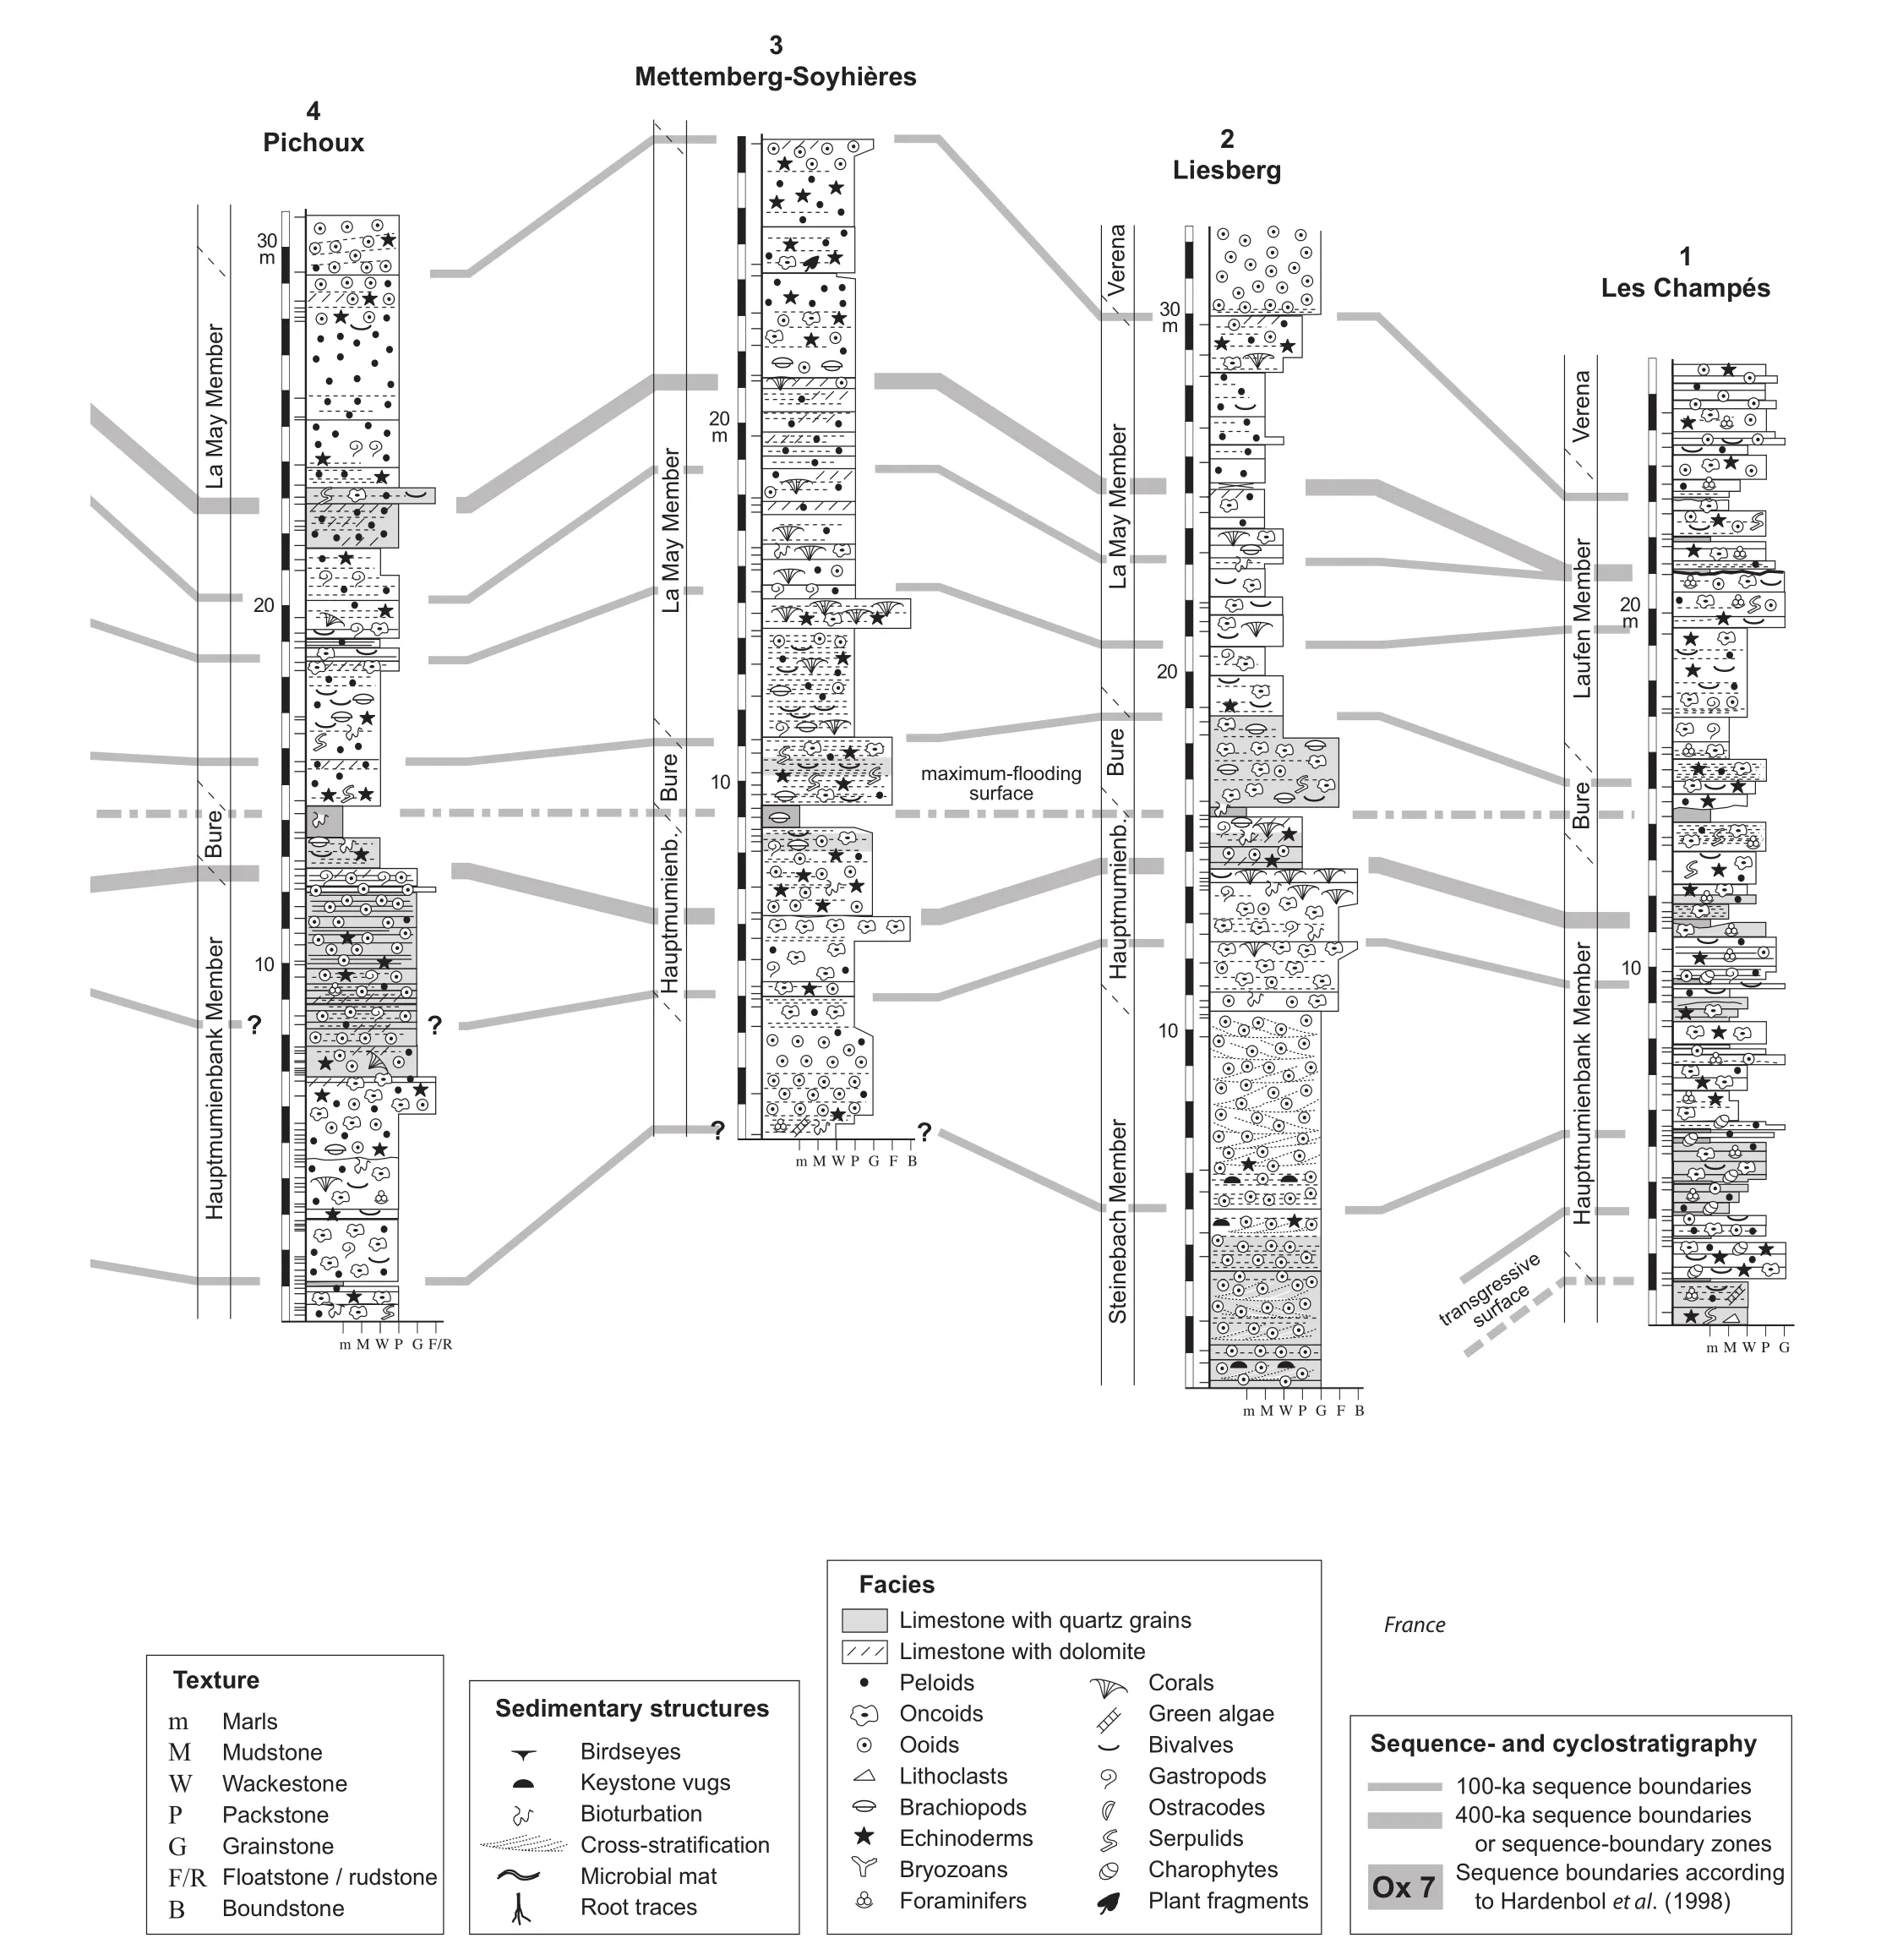
Figure 5, continued.
In order to reconstruct the facies evolution of the Jura Platform through space and time, steps of half a small-scale depositional sequence have been chosen.Each sequence numbered in Figure 5 is subdivided into a deepening part (transgressive deposits) and a shallowing, regressive part (highstand deposits; Fig. 6). Lowstand deposits are commonly absent or strongly reduced on the shallow platform. For both parts, the dominant facies category in each section is then reported on the corresponding map. Figure 7 shows 32 such maps. If a small-scale sequence is considered to cover 100 ka, an interval of 1.6 Ma is thus represented. It can be assumed that the sea-level fluctuations in the green-house world of the Late Jurassic were more or less symmetrical, in contrast to the strongly asymmetrical sea-level changes related to rapid melting and slow build-up of continental ice in ice-house worlds.Consequently, the transgressive and highstand parts of a small-scale sequence would each correspond to approximately 50 ka, including the hiatuses at the boundaries ofthe small-scale and elementary sequences (Strasser et al.,1999).
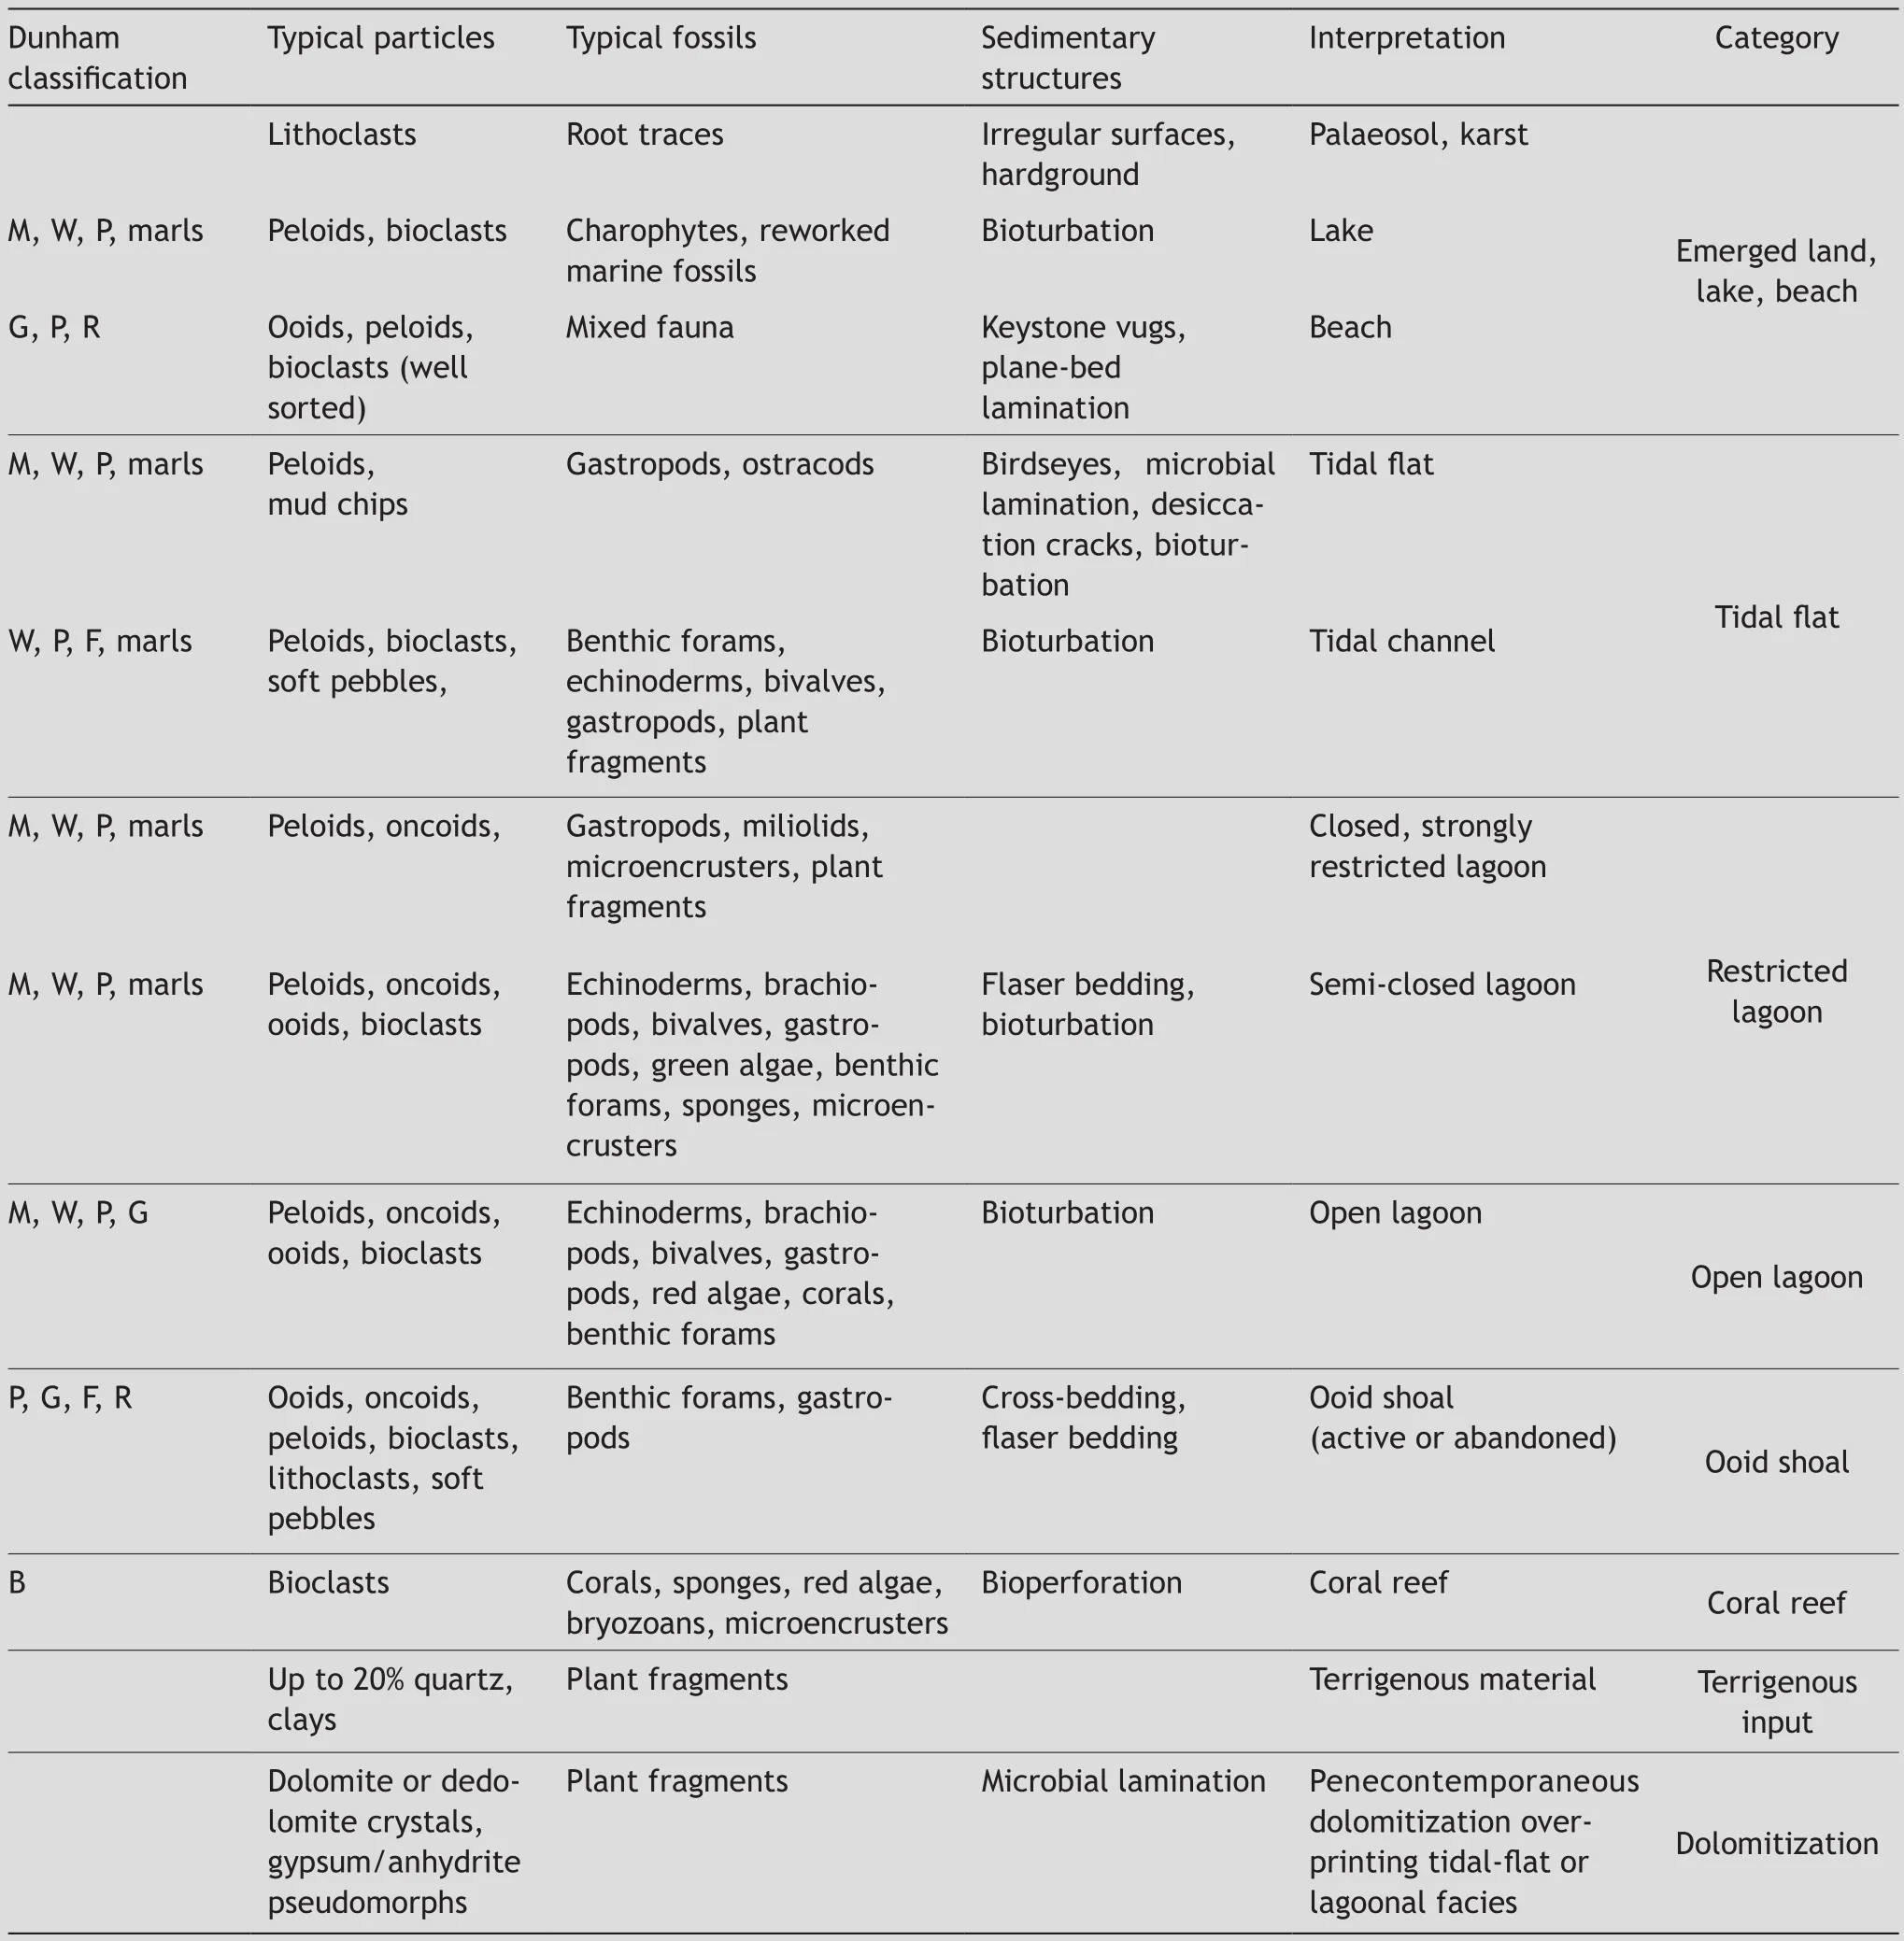
Table 2 Summary of microfacies encountered in the studied sections, interpretation of depositional environments, and definition of facies categories
Although the facies patterns at first glance look random in space as well as in time, there are certain trends that can be noted (Fig. 7):
1) Restricted-lagoonal facies dominate in small-scale sequences 1 to 8 but are then replaced by more open-marine facies up to the transgressive deposits of sequence 16. This major change is related to the prominent transgressive surface at the base of the Hauptmumienbank and Steinebach members (Figs 2 and 5).
2) Ooid shoals occur throughout the platform but are more often found in transgressive deposits than in highstand deposits of small-scale sequences (18 versus 9 occurrences). Furthermore, as for more open-marine facies,they become more abundant after the major transgression at the base of the Hauptmumienbank and Steinebach members (sequence 9).
3) Coral reefs occur on and off (more often in the highstand parts than in the transgressive ones) but always in the same palaeogeographic positions (in sections 9 and 6,and in the cluster of sections 2 and 3). Like the ooid shoals,coral reefs become more abundant after the important transgression at the base of sequence 9.
4) Tidal flats are found only in sections 6 and 7, and signs of subaerial exposure only in section 1.
6) Significant penecontemporaneous dolomitization occurs only in sequences 4, 15, and 16, and is most pronounced in the highstand deposits of sequence 16 (below sequence boundary Ox 8; Fig. 5).
Due to the limited outcrop conditions, not all sections contain all sequences (Fig. 5). Therefore, no statistical analyses (e.g., Markov chain) of vertical and lateral facies transitions have been performed.
8 Discussion
8.1 Role of platform morphology
The strongly variable thicknesses of the depositional sequences in the studied sections (Fig. 5) can at least partly be explained by differential subsidence (Pittet, 1994),which locally accelerated creation of accommodation while in other locations less space was available for the accumulation of sediment or even uplift could occur. Especially the area around section 1 was a high, explaining the reduced thickness of this section and the absence of sequence 16.Another - at least temporary - high can be assumed in the region of sections 6 and 7 where tidal flats occur in sequences 4 and 5. On the other hand, depressions accommodated more sediment per time unit, and siliciclastics could be channeled through such troughs (Hug, 2003). As the encountered facies generally suggest shallow to very shallow depositional environments, it can be assumed that the thickness of a sequence is a rough proxy for accommodation space. From Figure 5 it thus appears that depocenters shifted through time and that occasionally there was a tilt of the substrate (for example sequence 12, which is thin in section 6 and thickens significantly towards section 10).
Synsedimentary tectonics during the Oxfordian have also been invoked by Allenbach (2001) who found that the differentiation into platforms and shallow basins switched with time. During the late Middle Oxfordian, subsidence accelerated in the southwestern part of the study area and depocenters developed in vicinity of faults within the basement. However, no faults cutting through the Jurassic sedimentary cover have been observed so far. It is assumed that the Triassic evaporites below deformed plastically; in this way, vertical movements within the basement resulted in flexures of the overlying sediments. Locally opposing palaeocurrent directions encountered in the Effingen Member(Fig. 2) indicate that the subsidence of the whole area was not continuous but that individual blocks had their own subsidence history (e.g., Bolliger and Burri, 1970; Wetzel and Allia, 2000). This is consistent with the position of the Jura Platform on the northern passive margin of the Tethys Ocean (Wildi et al., 1989).
Besides the structuring of the platform by block faulting,also the irregular distribution of sediment bodies created morphology. Coral reefs and ooid shoals that possibly initiated on a structural high could migrate over the platform and - especially if early fresh-water diagenesis during a sea-level lowstand allowed for rapid cementation - create new, this time sedimentary highs. Structural and sedimentary highs redirected the oceanic and tidal currents and could isolate lagoons behind reef barriers or ooid shoals.This in turn could affect the water quality and, consequently, the ecological conditions for the carbonate-producing organisms.
In Figure 8, hypothetical cross-sections demonstrate how the platform originally was structured by block-faulting and how - throughout a sea-level cycle - facies may have shifted laterally. The vertical superpositions of facies reflect some of the situations that can be found in the studied sections (Fig. 5). However, it has to be considered that the platform was not only structured through(more or less) E-W trending synsedimentary faults but also through N-S striking ones. This created a complex pattern of compartments that moved more or less independently,producing depressions and highs in different palaeogeographic positions across the platform and thus explaining the often contrasted juxtapositions of facies seen in Figure 7.
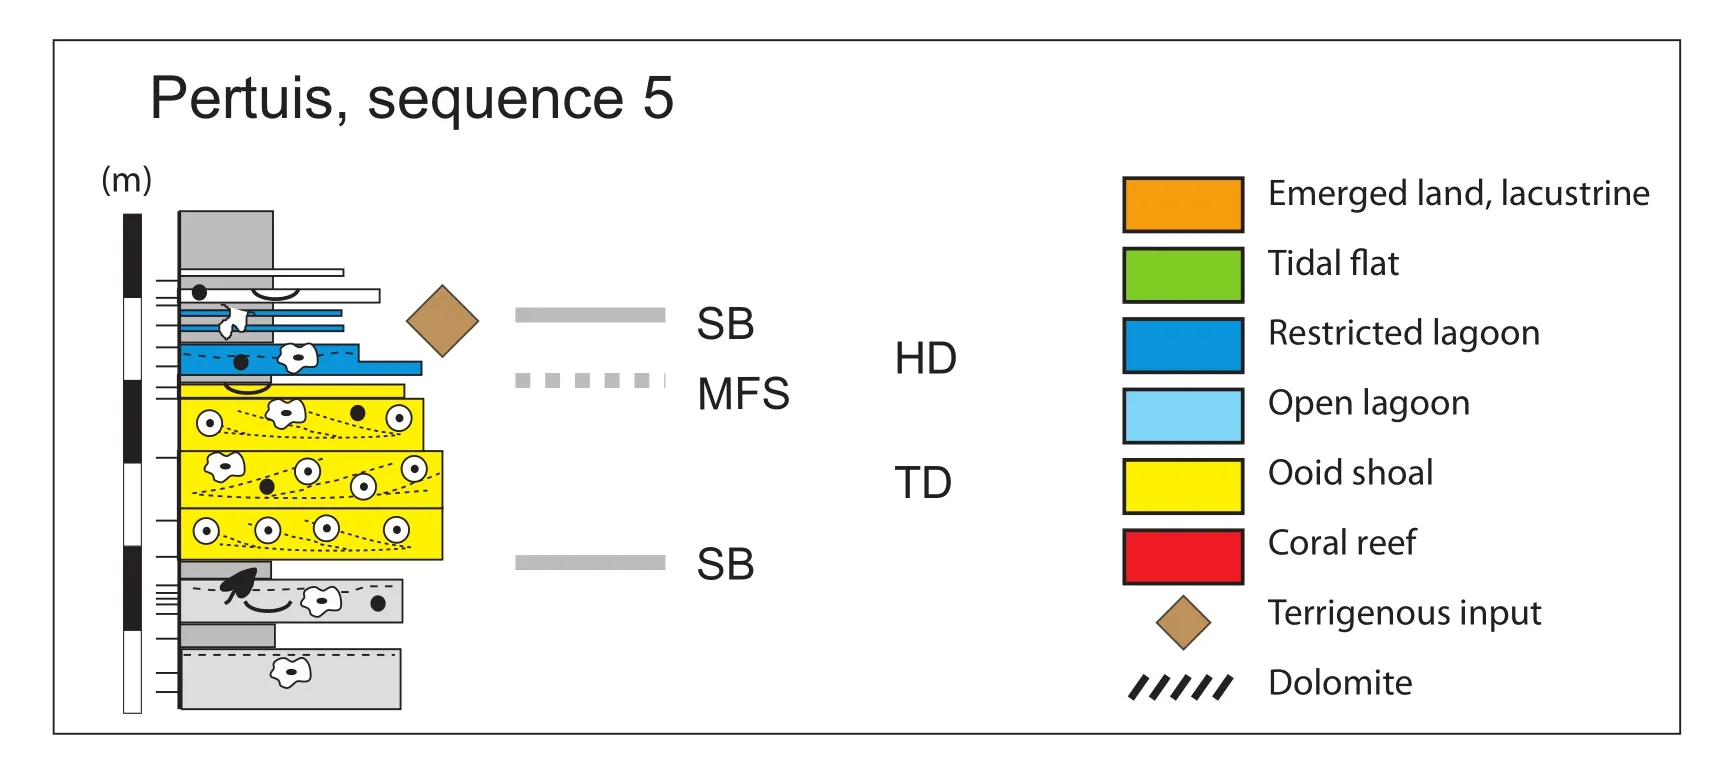
Figure 6 Left: Example of attribution of facies categories dominating the transgressive and the regressive parts of a small-scale sequence. SB: sequence boundary; MFS: maximum-flooding surface; TD: transgressive deposits; HD: highstand deposits. Right: legend to facies maps of Figure 7.
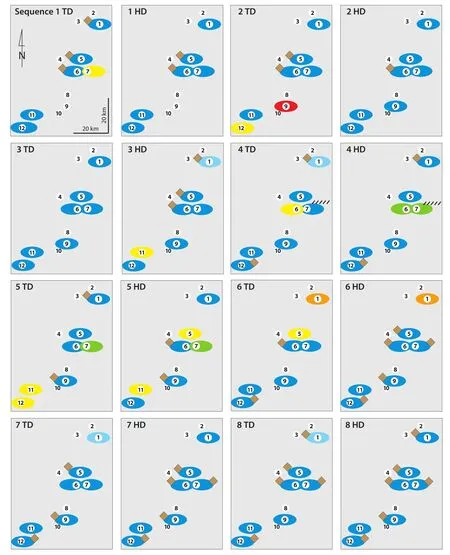
Figure 7 Palinspastic maps of sections 1 to 12, showing the dynamic facies evolution of the Jura Platform. Small-scale sequences 1 to 16 (defined in Fig. 5) have been subdivided into transgressive (TD) and highstand deposits (HD), and the dominant facies categories have been plotted (legend in Fig. 6).
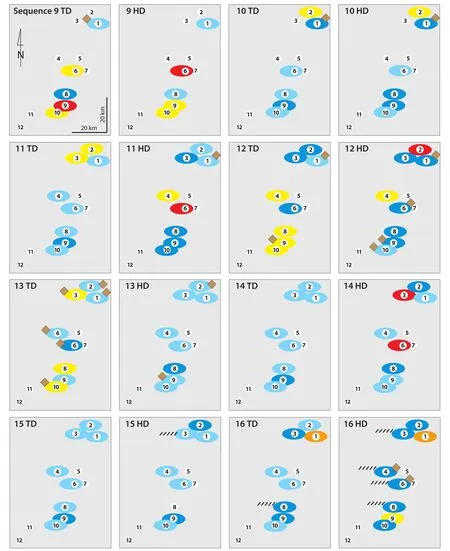
Figure 7, continued.
8.2 Role of sea-level changes, climate, and currents
Besides subsidence, the second important factor controlling accommodation and thus sediment accumulation is eustatic sea level. The hierarchical stacking of different orders of depositional sequences observed in the studied sections and the chronostratigraphic frame suggest that the high-frequency sea-level changes were controlled by insolation changes in the Milankovitch frequency band (see chapter 5). As estimated from decompacted small-scale sequences, the amplitudes of sea-level fluctuations in tune with the 100-ka short eccentricity cycle were in the order of a few meters (Pittet, 1994; Strasser et al., 2004, 2012).In the Late Jurassic, ice in high latitudes and altitudes probably was present (Eyles, 1993; Fairbridge, 1976; Frakes et al., 1992) but ice volumes were small and glacio-eustatic fluctuations of low amplitude. However, orbitally-induced climate changes also caused thermal expansion and retraction of the uppermost layer of ocean water (e.g., Gornitz et al., 1982; Wigley and Raper, 1987), thermally-induced volume changes in deep-water circulation (Schulz and Sch?fer-Neth, 1998), and/or water retention and release in lakes and aquifers (Jacobs and Sahagian, 1993). These processes contributed to high-frequency, low-amplitude sea-level changes (Conrad, 2013; Plint et al., 1992).
廣西中高端酒店發(fā)展問題與對策研究 ………………………………………………………………………………… 陸煥玲(6/44)
Ooid shoals are found preferentially in the transgressive parts of the small-scale sequences (18 out of 27 occurrences; Fig. 7), probably because tidal currents were most active when water depth was shallow after the initial flooding of the previously very shallow or subaerially exposed substrate. On the other hand, coral reefs occur more often in the highstand deposits of the small-scale sequences(5 out of 7 occurrences; Fig. 7). Apparently they needed a minimum water depth that in many places was only attained after maximum flooding, and they preferred a grainy substrate over a muddy one. It is interesting to compare sequence 9 in sections 9 and 6 (Fig. 5): in section 9, the coral reef sits on lagoonal, oncoidal packstone and is covered with oolite, while in section 6 the reef grew on an ooid shoal. In the first case, the oncoid lagoon offered enough hard grains and/or incipient hardgrounds to allow settlement of the coral planula (e.g., Hillg?rtner et al., 2001). In the second case it has to be assumed that the mobile shoal was stabilized (for example by dropping below the action of the tidal currents and subsequent incipient hardground formation) before the planula could successfully settle. Low sedimentation rates that allowed for hardground formation were possibly related to high-frequency sea-level changes that created the elementary sequences, and/or to lateral migration of depocenters.
Climate changes influenced rainfall over the exposed Hercynian massifs in the hinterland and thus terrigenous input of siliciclastics and nutrients. Clays and detrital quartz first accumulated in the deltas along the coasts (Fig.1) and then were ponded in depressions and reworked by currents before they arrived in the study area, explaining their irregular distribution (Figs 5 and 7). Dissolved nutrients travelled faster: in fact, Dupraz and Strasser (1999,2002) showed that the Oxfordian coral reefs in the Swiss Jura were first covered by microbialites resulting from nutrient excess before they were smothered by siliciclastics.
In the Late Oxfordian, evaporite pseudomorphs are locally found to be contemporaneous with increased siliciclastic input. This implies that either the siliciclastics were furnished during a humid phase and then redistributed during more arid conditions, or else that rainfall occurred above the crystalline massifs to the north whereas the carbonate platform further to the south was situated in a more arid climate belt (Hug, 2003). A palaeolatitudinal control on the distribution of siliciclastics was demonstrated by Pittet (1996) and Pittet and Strasser (1998)with high-resolution correlations between the Swiss Jura and Spain: while siliciclastics in the Jura concentrate rather around the boundaries of small- and medium-scale sequences, they occur in the transgressive or maximumflooding intervals in the time-equivalent sequences of the Spanish sections.
8.3 A matter of scale
When comparing the time resolution of 50 ka to monitor the evolution of a carbonate platform as in this example from the Swiss Jura with the rate of environmental changes seen today on recent carbonate platforms, it becomes clear that only a very crude picture of the past can be drawn.The same holds for the resolution in space because outcrop conditions in the Swiss Jura do not allow for logging many closely-spaced and long sections that can be interpreted in terms of sequence- and cyclostratigraphy, nor for following lateral facies changes over more than a few tens of meters. The comparison of the palinspastic map of the Jura with satellite images of Belize and the Bahamas makes this discrepancy well visible (Fig. 9). While the ooid shoals of Joulter Cays occupy an area that is comparable to that covered by several sections in the Swiss Jura, the details of tidal channels and small islands are lost. In Belize, the complex pattern of elongated islands and lagoons cannot be reproduced by the sections that describe the Jura Platform. However, the facies distribution shown in Figure 7 implies that similar facies mosaics must have existed in the Oxfordian as are described from the modern platforms such as found in the Bahamas (e.g., Rankey and Reeder, 2010) or in Belize (e.g., Purdy and Gischler, 2003).
9 Conclusions
Conventional palaeogeographic maps of carbonate platforms are important to indicate their position with respect to land masses and ocean basins, to place them at a certain palaeolatitude, and to draft a rough distribution of sedimentary facies. However, such maps often are time-averaged over millions of years and therefore cannot monitor the complex facies evolution through space and through time. In the Oxfordian sedimentary record of the Swiss Jura Mountains, a high-resolution sequence- and cyclostratigraphic framework is available, which allows following a 1.6 Ma history of a shallow, subtropical, carbonate-dominated platform with time-steps of about 50 ka. Based on the facies analysis of 12 sections logged at cm-scale and on the palinspastic positioning of these sections on the platform, the following conclusions can be drawn:
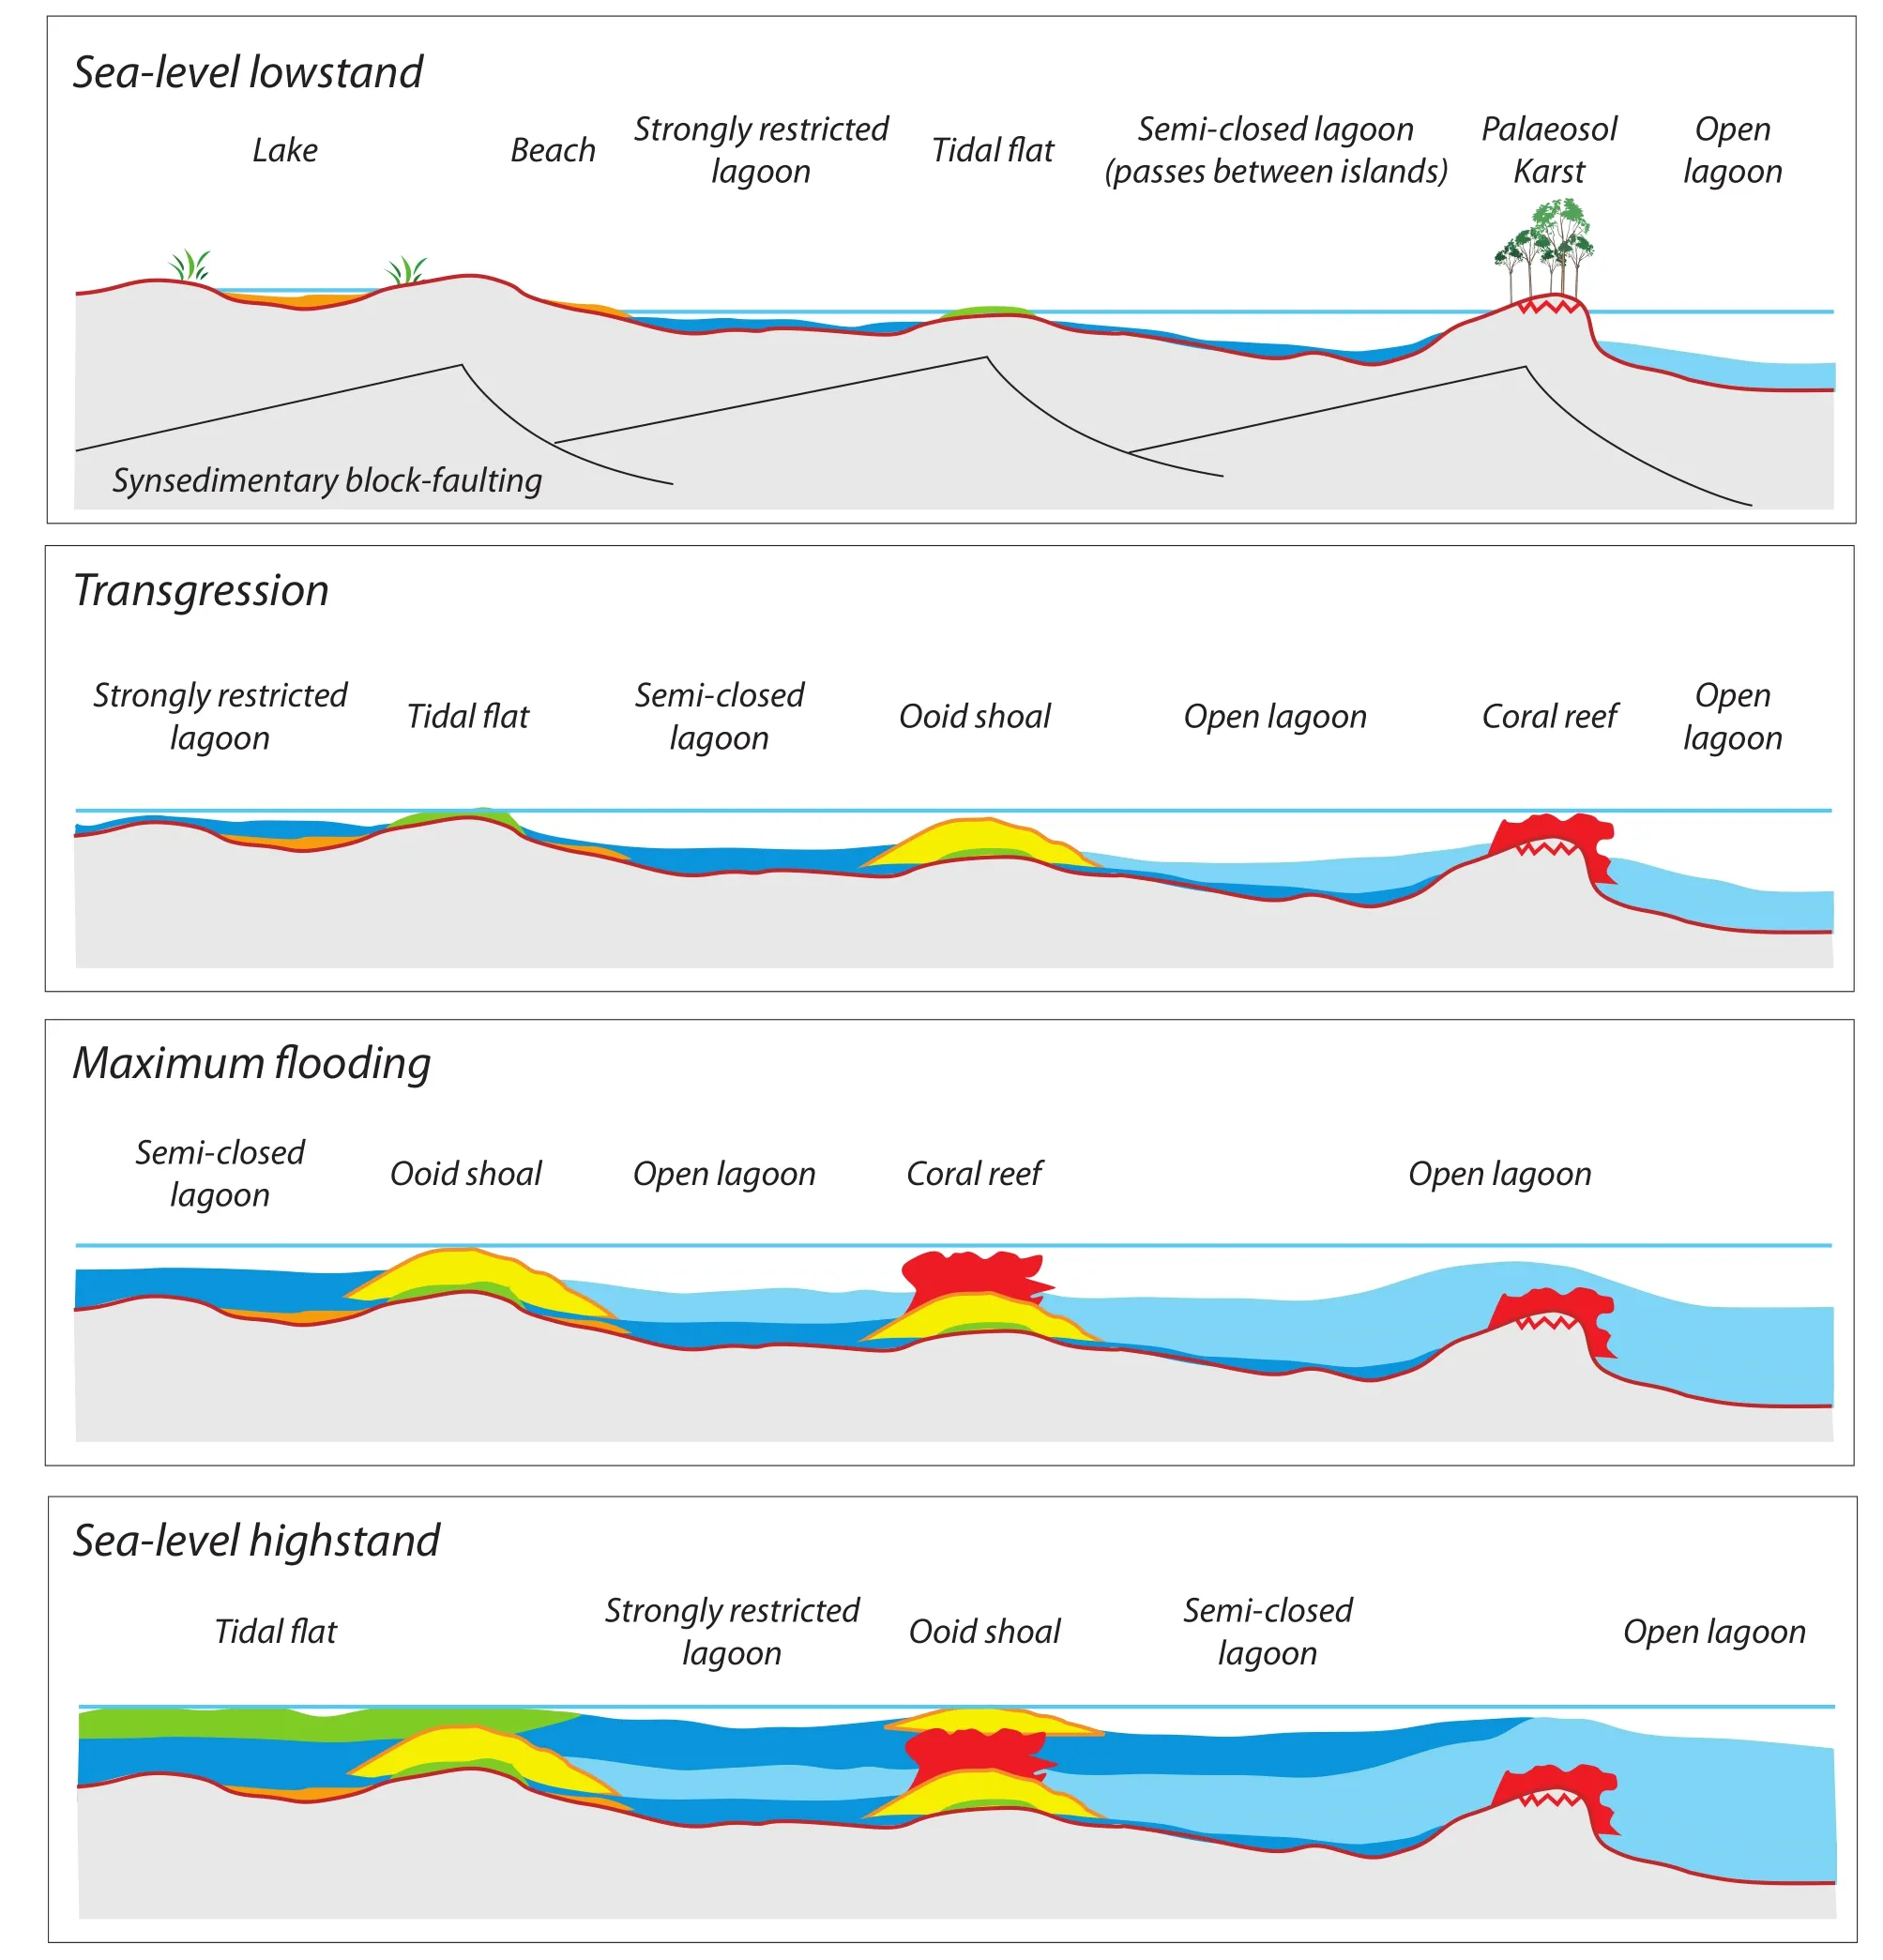
Figure 8 Sketches of facies distribution on a hypothetical carbonate platform structured by synsedimentary faulting. Situations during sea-level lowstand, transgression, maximum flooding, and sea-level highstand are inspired from the superposition and juxtaposition of facies as shown in Figures 5 and 7.
- Platform morphology created through synsedimentary block-faulting determined the position of islands, tidal flats, ooid shoals, and coral reefs that installed themselves preferentially on highs.
- Through migration of reefs and shoals and their rapid stabilization, also sedimentary highs were created.
- The highs were separated by depressions, in which clays accumulated to form marly deposits, and where the ecological conditions for the carbonate-producing organisms were partly or fully restricted (in terms of water energy and/or oxygenation).
- High-frequency sea-level changes in tune with the orbital cycles of short (100 ka) and long (400 ka) eccentricity controlled at least partly the vertical facies evolution of depositional sequences (deepening-shallowing trends).
- While facies distribution through space and time at first glance looks random, some trends can be seen: ooid shoals preferentially formed during transgression, while coral reefs are more common in highstand deposits.
- The effects of sea-level changes linked to the 20-ka precessional cycle are often difficult to demonstrate in the studied sections, as autocyclic processes were superimposed.
- Siliciclastic and nutrient input from the hinterland was controlled by sea-level and/or climatic changes and was sporadically distributed by currents all over the platform.
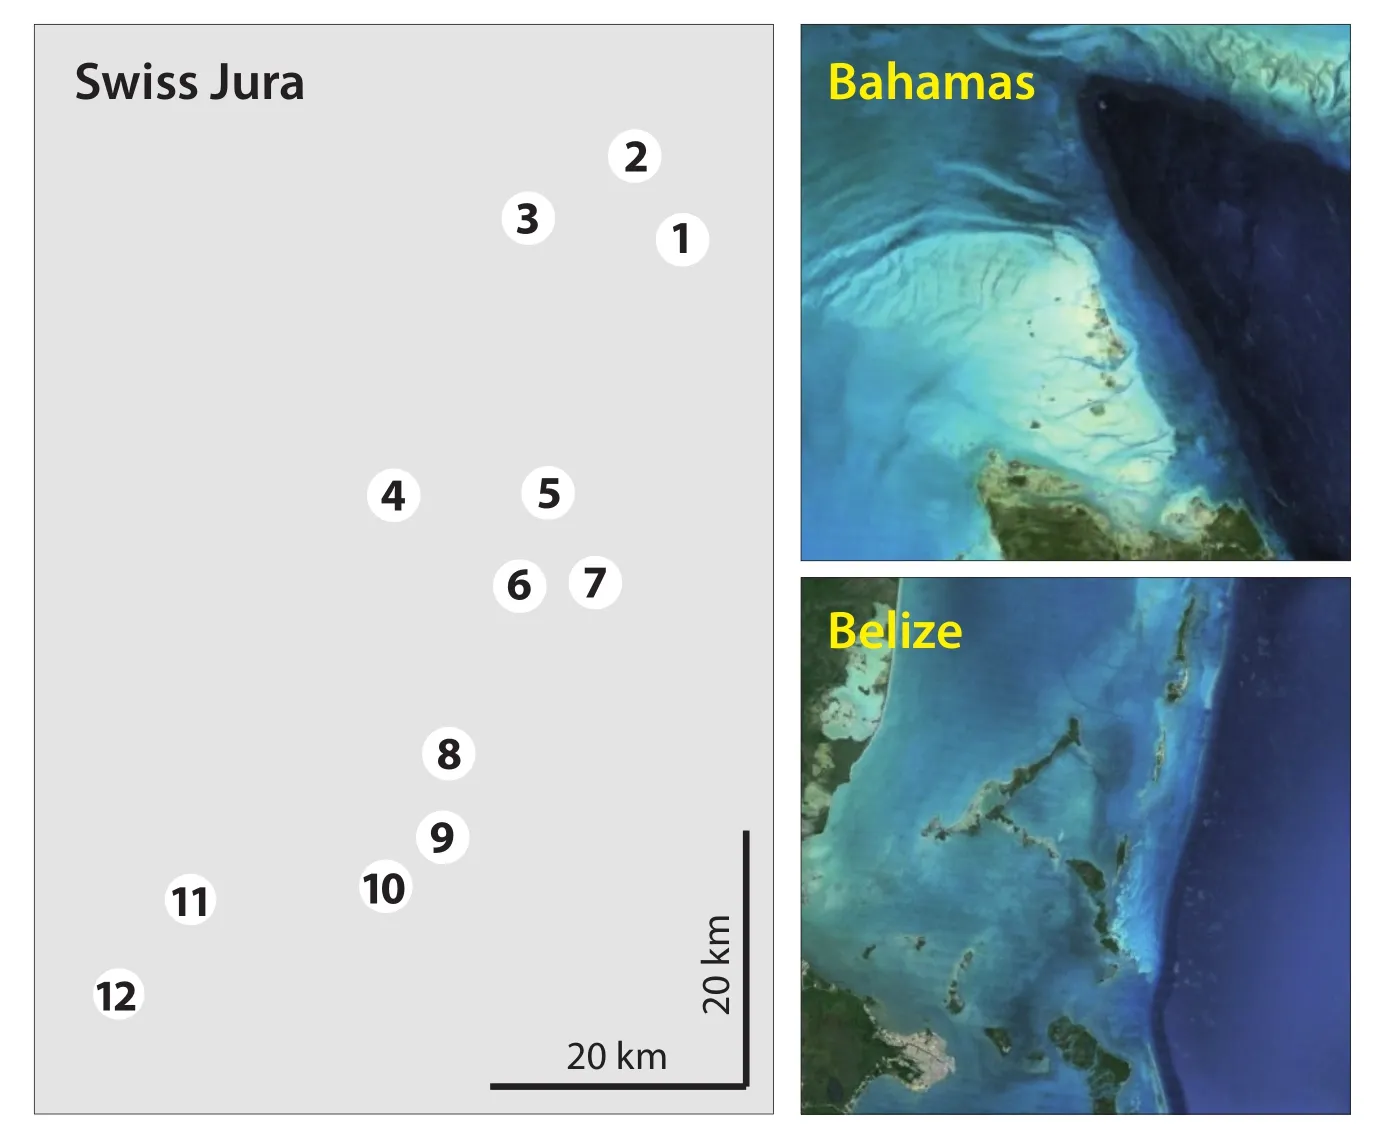
Figure 9 Comparison between the studied sections in the Swiss Jura (palinspastic map) and - at the same scale - examples of recent carbonate platforms in the Bahamas (white area: ooid shoals of Joulter Cays) and Belize (Belize City on the promontory in lower left corner). Satellite images from Google Earth.
- Co-occurrence of dolomite and siliciclastics suggests that climate may have been humid in the hinterland while it was arid on the studied platform.
- Coral reefs demised due to nutrient and siliciclastic input and were also influenced by sea-level changes. They recovered at regular intervals, albeit often in another location on the platform.
Although much detail may be gained through this type of analysis, it never can reflect the true history of a carbonate platform. This becomes evident when comparing the studied Jura Platform with the complex facies mosaics found on modern platforms such as the Bahamas or Belize.First, the spatial resolution of the outcrops is not dense enough to monitor lateral facies changes at the scale of tens or hundreds of meters as they commonly occur today and also occurred in the past (as shown punctually in some outcrops in the Swiss Jura). Second, the time resolution of 50 ka is hypothetical and depends on the validity of the correlations between the sections. Furthermore, facies changes through time happen (and happened) on timescales of days (if induced by storms) to tens, hundreds,or a few thousands of years, which is must faster than the hypothetical 50 ka. Consequently, shorelines, reefs, and shoals could have shifted, islands could have appeared and disappeared, without leaving a trace in the visible sedimentary record.
The present study shows the potential that a detailed facies analysis, supported by sequence- and cyclostratigraphy, can offer towards a better representation of palaeogeography. On the other hand, we are still far from being able to reconstruct all the features of the Jura Platform,which certainly was as complex as any modern carbonate system.
Acknowledgements
This study is based on research carried out with the financial support of the Swiss National Science Foundation, which is gratefully acknowledged (Projects No. 20-41888, 20-43150, 20-46625, 20-67736, and 20-109214).We thank Ian D. Somerville who invited us to present our results at the IAS International Sedimentological Congress in Geneva. We also thank Tom van Loon and an anonymous reviewer for their constructive comments on the first version of the manuscript.
 Journal of Palaeogeography2015年3期
- Journal of Palaeogeography的其它文章
- Sequence architecture of a Jurassic ramp succession from Gebel Maghara (North Sinai, Egypt): Implications for eustasy
- Characteristics of the Paleozoic slope break system and its control on stratigraphic-lithologic traps: An example from the Tarim Basin, western China
- Lithofacies architecture and palaeogeography of the Late Paleozoic glaciomarine Talchir Formation, Raniganj Basin, India
- 3D palaeogeographic reconstructions of the Phanerozoic versus sea-level and Sr-ratio variations: Discussion
- Reply to comments by G. Shanmugam(2015) and A. J. (Tom) van Loon (2015)on “3D palaeogeographic reconstructions of the Phanerozoic versus sea-level and Sr-ratio variations”
- 2nd International Palaeogeography Conference October 10–13, 2015, Beijing, China
