Determination of reference intervals for metabolic profile of Hanwoo cows at early,middle and late gestation periods
Da Chuan Piao,Tao Wang,Jae Sung Lee,Renato SA Vega,Sang Ki Kang,Yun Jaie Choi*and Hong Gu Lee*
Determination of reference intervals for metabolic profile of Hanwoo cows at early,middle and late gestation periods
Da Chuan Piao1,Tao Wang2,3,Jae Sung Lee4,Renato SA Vega5,Sang Ki Kang1,Yun Jaie Choi1*and Hong Gu Lee4*
Background:Metabolic profile was initially designed as a presymptomatic diagnostic aid based on statistical analyses of blood metabolites to provide an early warning of certain types of metabolic disorder.However,there is little metabolic profile data available about Korean Hanwoo cows.Therefore,this study aimed to determine the reference intervals of metabolic profile for Korean Hanwoo cows.
Methods:Healthy animals(2,205)were selected and divided into early(day 1 to 95),middle(day 96 to 190)and late(day 191 to 285)period according to their gestating period.Metabolic profile including total protein(TP),albumin (Alb),urea(UREA),glucose(Glu),total cholesterol(T-Cho),long-chain fatty acid(LCFA),aspartate aminotransferase(AST), gamma-glutamyl transpeptidase(GGT),creatinine(Crea),calcium(Ca),inorganic phosphorous(iP)and magnesium(Mg) were analyzed using a TBA-40FR automatic biochemical analyzer.The data of Korean Hanwoo cows were then compared to those of the Japanese Wagyu cows.
Results:Most of the data of the Korean Hanwoo cows were relatively higher than those of Japanese Wagyu cows,with the exception of Glu and GGT.This may indicate that the nutritional level of feed for the Korean Hanwoo cows was higher than that of the Japanese Wagyu cows because of the different feeding system.In particular,relatively higher levels of UREA and LCFA were observed in the Korean Hanwoo cows,and this may also contribute to the low reproduction efficiency.
Conclusions:These findings may provide some theoretical basis for understanding the reproductive and feeding situation of Korean Hanwoo cows.
Hanwoo cows,Metabolic profile,Reference intervals,Wagyu cows
Introduction
Blood metabolites reflect the nutritional status as well as the physiological condition of an animal.The physiology of a cow changes in the peripartum period,and it is important to monitor nutritional and physiological status rapidly and precisely,because these cows are prone to peripartum metabolic disorders and reproductive diseases. The metabolic profile was initially designed as a presymptomatic diagnostic aid based on statistical analyses of blood metabolites to provide an early warning for certain types of metabolic disorders[1].Subsequently,metabolic profile has been applied to assess nutritional status[2,3], improve feeding management and diagnose metabolic disorders in dairy herds[4,5].Reference intervals are useful when interpreting a set of metabolic profile results.Payne et al.[6]estimated normal intervals(95%confident interval)using 2,400 blood samples from 13 dairy herds.Kida [4]established a 10-day criteria for metabolic profile by using data from 29,043 cows in 1,130 commercial dairy herds covering dry and lactation periods[5].The practicability of the criteria was evaluated in herds withperipartum diseases,and the metabolic abnormalities were successfully detected not only in the herd but also in individual cows.However,little metabolic profile data has been found about Korean Hanwoo cows. Therefore,in the current study,twelve blood metabolites were analyzed in order to determine reference intervals of metabolic profile at the early,middle and late reproduction period in Korean Hanwoo cows. Moreover,the data of Korean Hanwoo cows were also compared to those of Japanese Wagyu cows obtained from NOSAI[7].
Materials and methods
Experiment design,animals and sampling
A total of 2,205 healthy Korean Hanwoo cows were selected from various farms in Jangsu-gun Jeollabuk-do, South Korea from 2006 to 2011.All experimental procedures were in accordance with the“Guidelines for the Care and Use of Experimental Animals of Seoul National University”.No abnormalities in these animals were observed or monitored.Generally,all cows were housed indoors and some were on pasture in summer.Feeding systems included continuous feeding of a total mixed ration or separate feeding of forage and concentrates.The metabolic profile was conducted through four seasons. The animals were sorted into four groups according to the plasma pregnancy-associated glycoproteins(PAGs) (Table 1).Blood samples were taken via the external jugular vein after the morning meal.Serum was recovered from the blood samples through centrifugation at 3,500 rpm at 4°C for 15 min,and stored at-80°C until required.All samples were analyzed within one week of being collected.
Analysis of metabolic profile
The metabolic profile was performed with a Toshiba Accute Biochemical Analyzer-TBA-40FR(Toshiba Medical Instruments,Otawara-shi,Tochigi-ken,Japan)according to a previously described method[5].Indicators for protein metabolism consist of total protein(TP),albumin(Alb) and urea(UREA);for energy metabolism,glucose(Glu), total cholesterol(T-Cho)and long-chain fatty acids(LCFA); for liver and kidney function,aspartate aminotransferase(AST)and γ-glutamyl transpeptidase(GGT)and Creatinine(Crea);for mineral metabolism,calcium (Ca),inorganic phosphorus(iP)and magnesium(Mg) (Table 2).All the reagents required for this procedure were purchased from Wako Pure Chemical Industries, Ltd.(Chuo-ku,Osaka,Japan).The reference intervals were determined by following the recommendations of the Clinical and Laboratory Standards Institute(CLSI).

Table 1 Classification of cows into four stages according to pregnant status
Statistical analysis
The metabolic profile data were presented as Mean±SD and analyzed using a one-way analysis of variance(one-way ANOVA)(SPSS Inc.,Chicago,IL,USA).In all cases,differences were considered significant if P<0.05.
Results and discussion
The metabolic profile of Korean Hanwoo cows in different physiological stages were determined according to data collected from 2,205 animals(Table 3).Protein metabolism:It has been well known that TP,Alb and UREA levels are indicators of sufficient protein intake from diets.Alb is not a long-term indicator of protein intake because of its relatively short half-life in the blood.On the other hand,UREA level is a good indicator of longterm intake of dietary protein[8].TP,Alb and UREA were significantly(P<0.05)increased from the EP to LP periods,suggesting that there was an increased intake ofdiet.The mean level of TP was slightly higher than in previous reported studies[9].Energy metabolism:In the past three decades,the question of whether Glu can be used as indicator for energy metabolism has been discussed[8].Blood Glu has a moderate diagnostic value in the assessment of nutritional status of cattle,as it varies moderately in blood[10].It has also been reported that glucose can be used in combination with other indicators to assess energy metabolism[9].The serum Glu concentration detected in this study was similar with one previously reported[9],but lower than some other reported studies in other species[11,12].These differences may be attributed to the species differences or the feeding system.Significantly higher levels of LCFA were observed at the EP and LP stage(P<0.05).Liver function and kidney function:AST and GGT are enzymes that indicate liver cell damage and biliary obstruction, respectively.In this study,the mean level of AST was higher than in previously reported studies[9].Therefore, it seemed that the high level of AST reveals early signs of liver cell damage in Korean Hanwoo cows.Mineral metabolism:Serum concentrations of Ca and IP reflect dietary calcium and phosphate intake[8],and it is well known that serum Ca is under homeostatic control of the endocrine system.Ca,IP and Mg have a high diagnostic value in determining the nutritional status of animals due to their low variability in blood[10].In this study,low variability of the three indicators was alsoobserved,but the mean values of these three indicators were higher than in previously reported studies.This may be due to the high level of mineral supplementation in the diet of Korean Hanwoo cows.
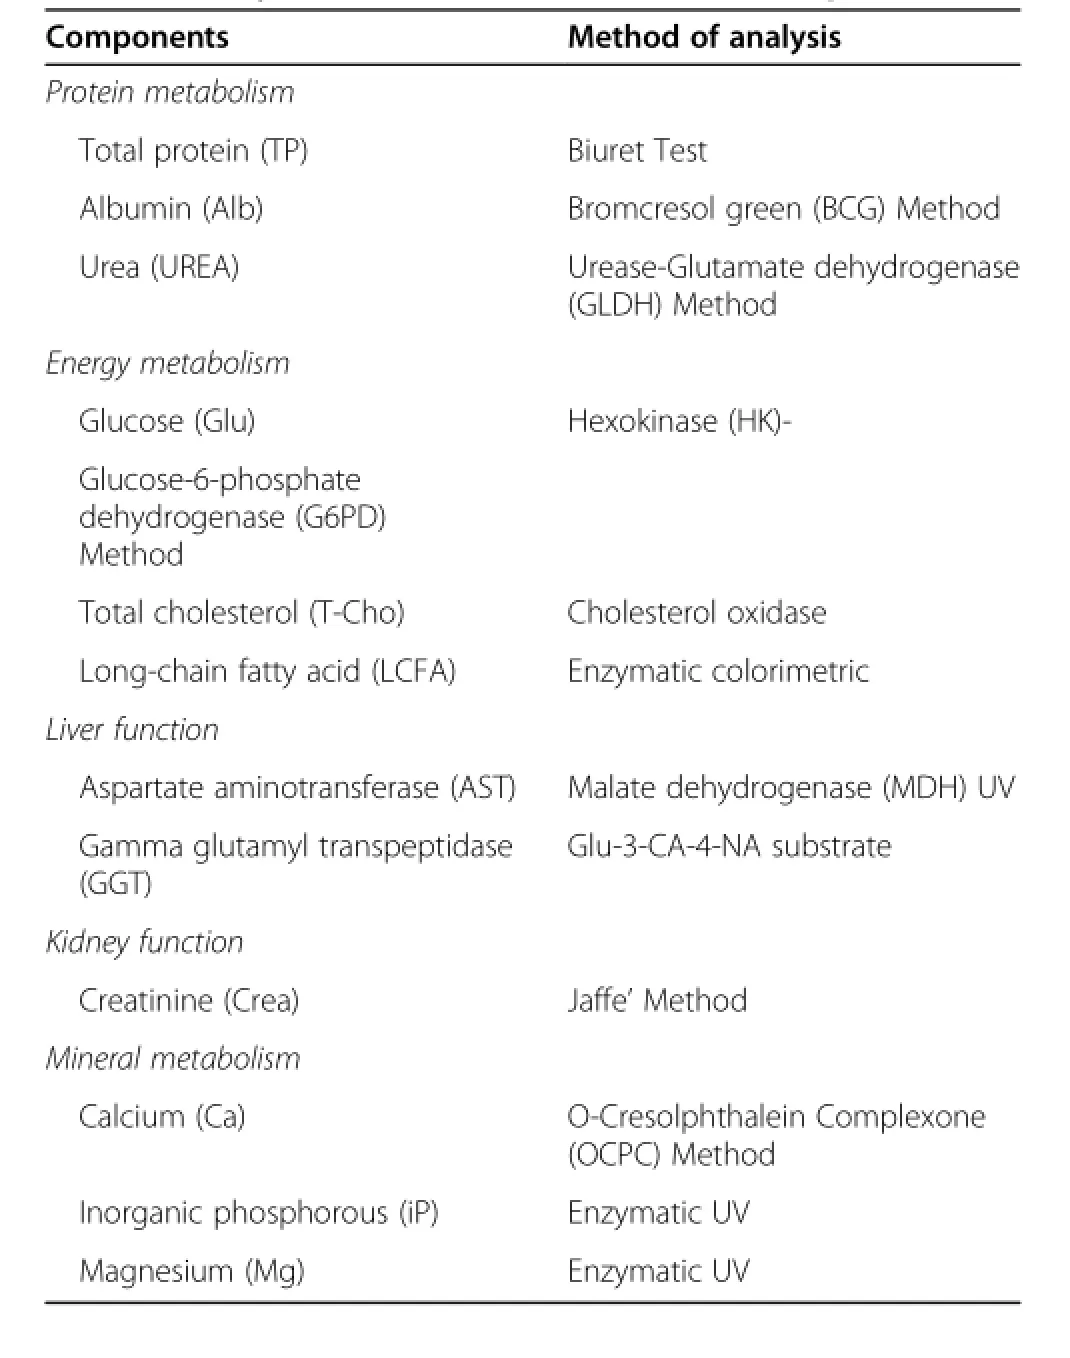
Table 2 Analytical method used for metabolic profile
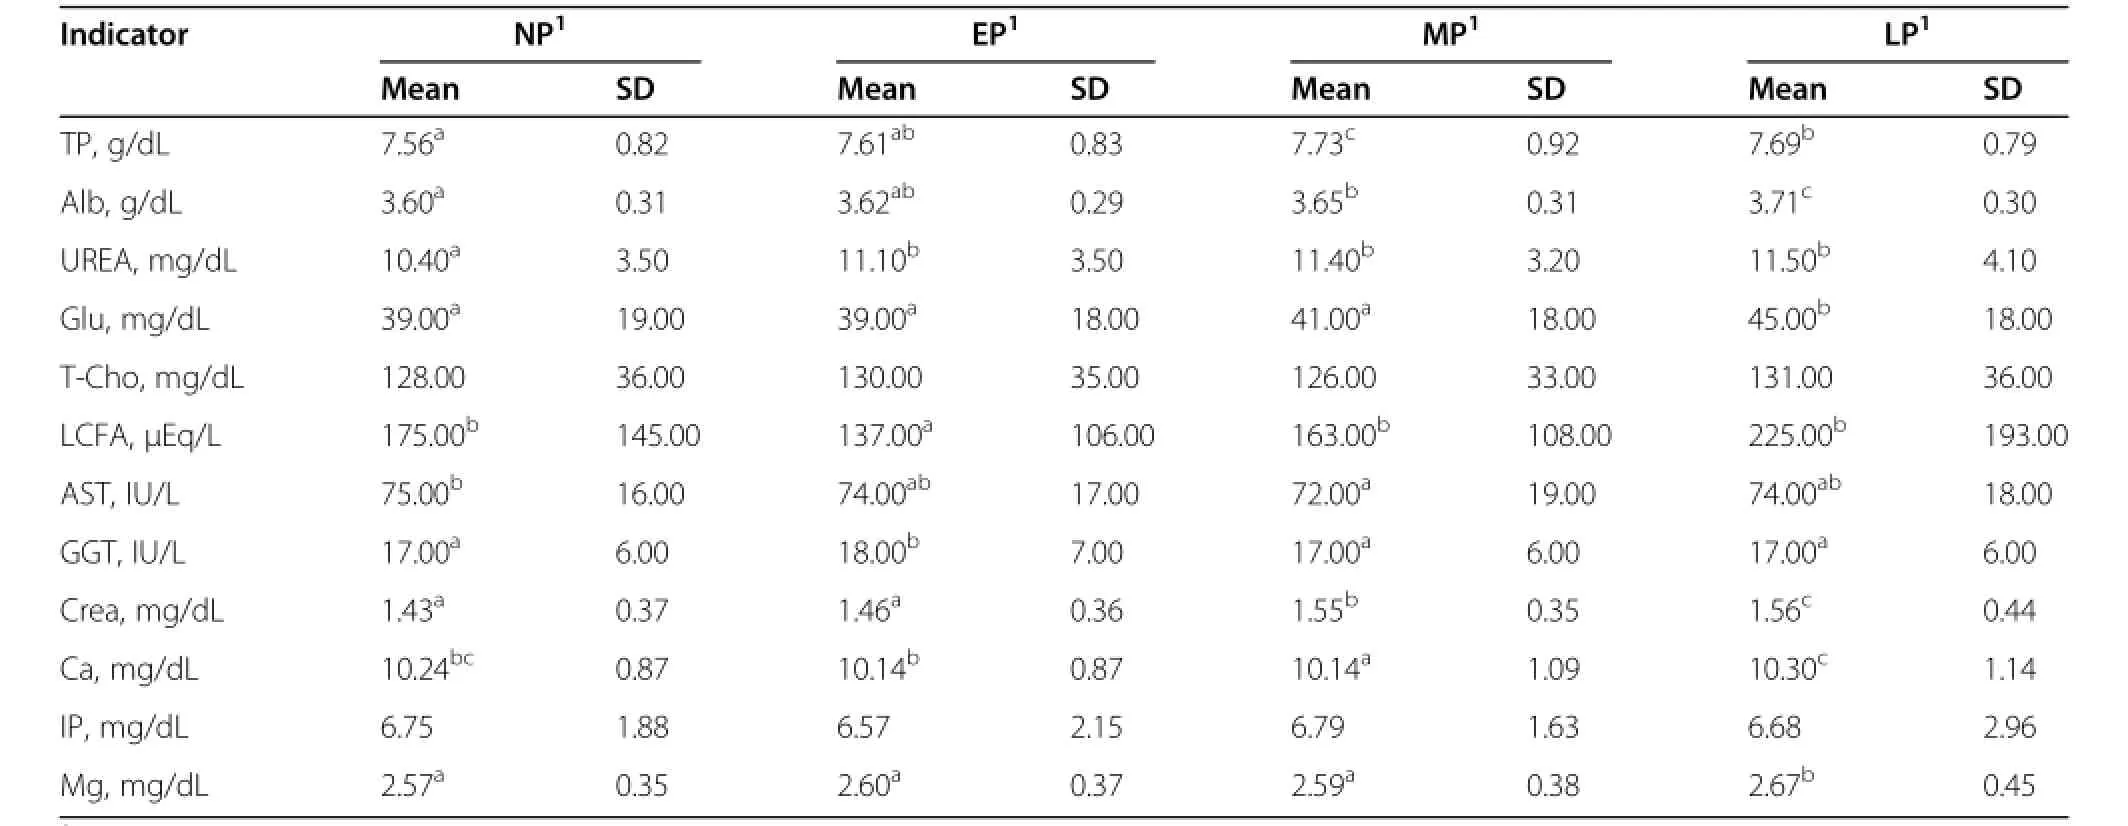
Table 3 Serum metabolic profile of Korean Hanwoo cows at different stages of pregnancy
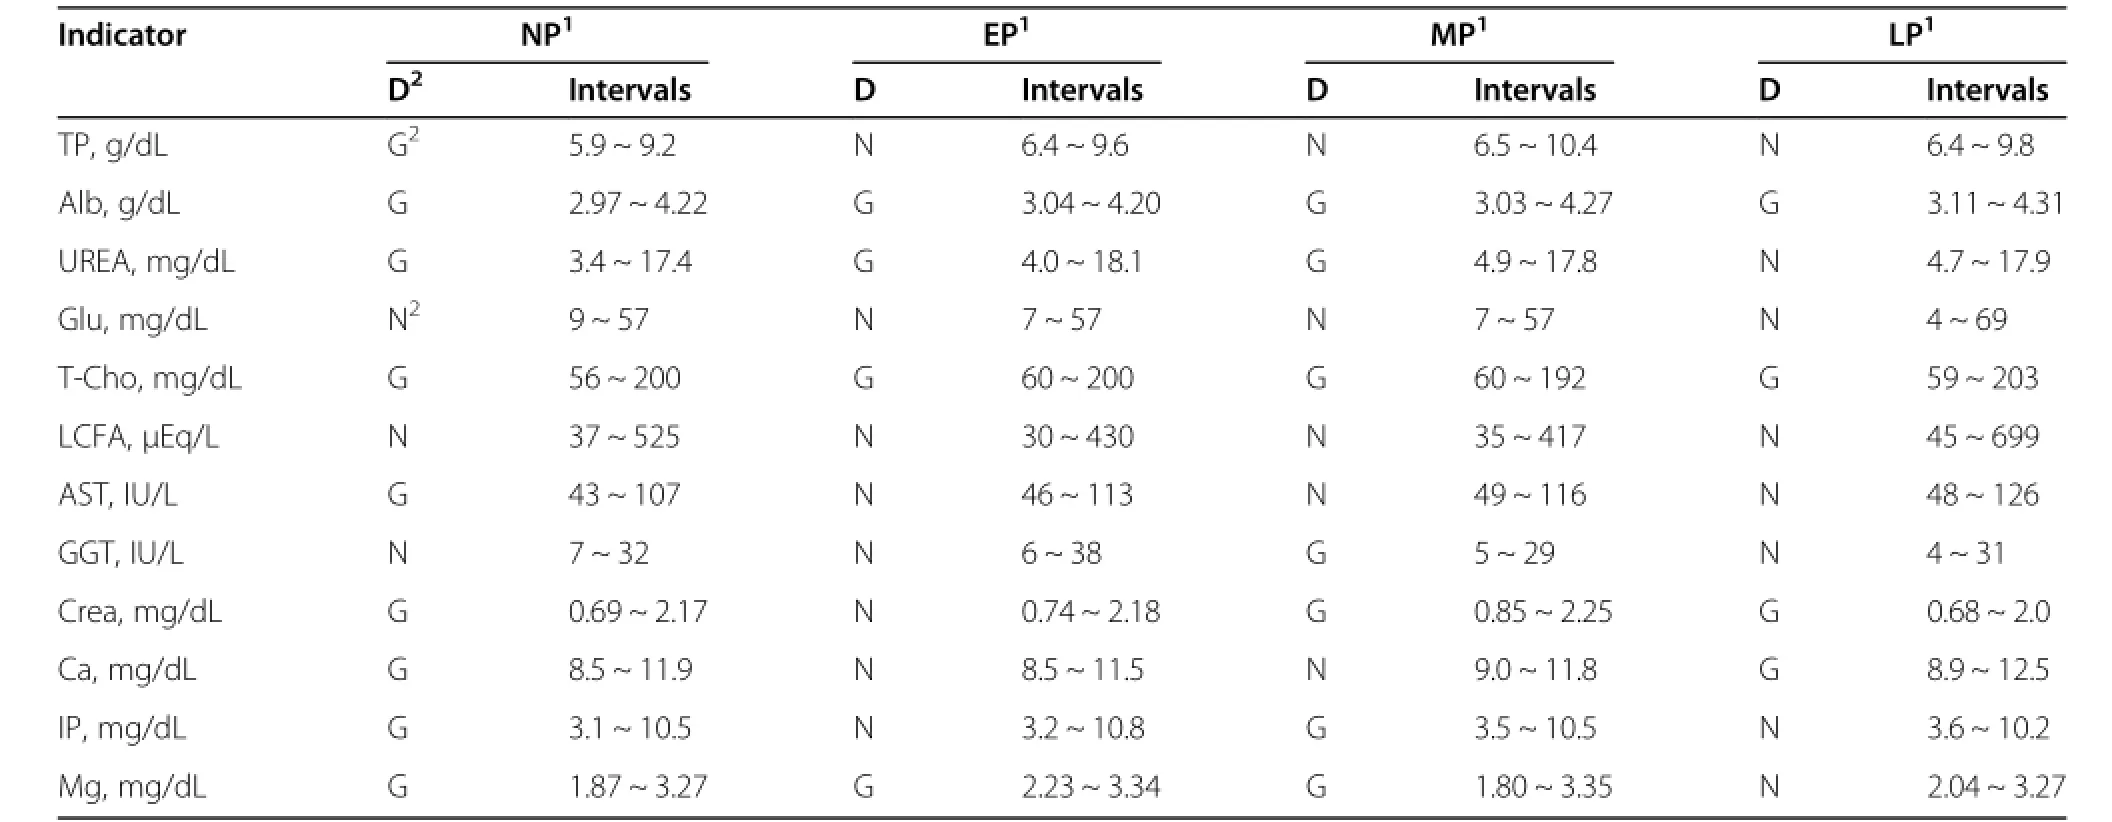
Table 4 Reference intervals of serum components of Korean Hanwoo cows at different stages of pregnancy
When interpreting laboratory data for metabolic profile from a herd or individual animal,reference intervals need to be determined for clinical application.In this experiment,we also determined reference intervals for serum components at 4 physiological stages in Korean Hanwoo cows,as are shown in Table 4.It was found that reference intervals were changed according to physiological status.These reference intervals may provide a basis for interpreting data analysis and metabolic disorder.A comparison between Korean Hanwoo and Japanese Wagyu cows was performed.The amounts of serum components are affected by several factors including nutrition,physiological status,breed,season and age.
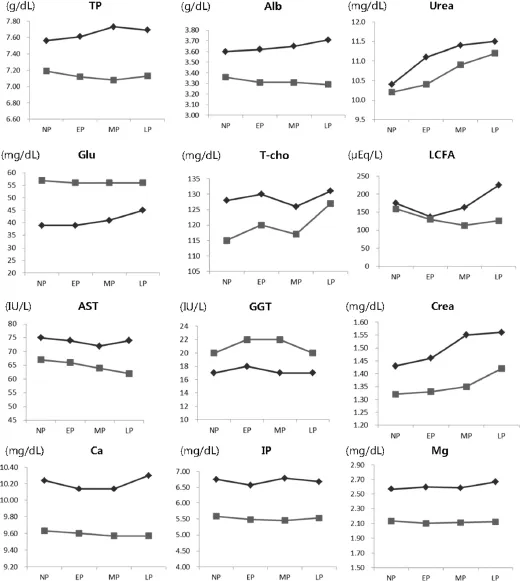
Figure 1 Comparison of mean serum components between Korean Hanwoo cows()and Japanese Wagyu cows().NP:non-pregnancy,EP:early pregnancy,MP:middle pregnancy,LP:late pregnancy.
The mean values of serum components in Korean Hanwoo and Japanese Wagyu cows were compared during four physiological stages(non-pregnant,early pregnancy,middle pregnancy and late pregnancy),because the physiology of these two breeds was known to be very similar.The results of this comparison,which are shown in Figure 1,revealed that the patterns of serum components were very similar in the two breeds.All the serum components were higher in Korean Hanwoo than in Japanese Wagyu cows during all test periods,with the exception of Glu and GGT.TP,Alb and UREA indicate the protein intake of an animal from diet[4].In this experiment,mean values of these three indicators were higher in Korean Hanwoo than in Japanese Wagyu cows,in all physiological stages.This may indicate that the protein level in the diets of Korean Hanwoo cows was higher than in the diets of Japanese Wagyu cows. Blood Glu,T-cho and LCFA are the most commonlyused blood metabolites to assess the energy metabolism.The physiological status of an animal affects the serum concentration of these related metabolites in energy metabolism.The elevated level of LCFA at MP and LP periods may indicate that there was a negative energy balance during pregnancy periods in Korean Hanwoo cows.On the other hand,the mean value of serum Glu was lower in Korean Hanwoo than in Japanese Wagyu cows.For this reason,we suggest that the elevated level of LCFA and the lowered level of Glu may be caused by an insufficient energy intake.Serum activity of AST and GGT indicate liver function,and Crea indicates kidney function.AST is an enzyme that expresses in many tissues,particularly in liver and cardiac muscle[13].In this study,AST and Crea were higher in Korean Hanwoo than in Japanese Wagyu cows;however,GGT was lower in Korean Hanwoo than in Japanese Wagyu cows.Serum Ca,Mg and IP were higher in the Korean Hanwoo than in the Japanese Wagyu cows,indicating that the mineral level was higher in Korean Hanwoo cows’diets than in Japanese Wagyu cows.In this study,the patterns of serum components were highly similar in the two breeds.
Conclusions
In this study,the metabolic profile of the Korean Hanwoo cows was determined.The differences in the metabolic profile between Korean Hanwoo cows and Japanese Wagyu cows were also verified.Our findings may provide some basis for understanding the reproductive and feeding situations of Korean Hanwoo cows.
Competing interests
The authors declare that they have no competing interests.
Authors’contributions
YJ and HG conceived and designed the Experiments.DC executed the experiment and analyzed the samples.TW and RSA revised the manuscript. JS and SK provided help during the animal experiment.All authors interpreted the data,critically revised the manuscript for content and approved the final version.
Acknowledgements
This research was supported by Bioindustry Technology Development Program(313020041SB010)for Ministry of Agriculture,Food and Rural Affairs, Republic of Korea and Concentrated Research Professor Program for Konkuk University,Seoul,Republic of Korea.
Author details
1Laboratory of Animal Cell Biotechnology,Department of Agricultural Biotechnology,Seoul National University,Shinlim-dong,Kwanak-gu,Seoul 151-742,South Korea.2College of Animal Science and Technology,Jilin Agricultural University,2888 Xincheng Street,Nan-guan District,Changchun 130118,People’s Republic of China.3Key Laboratory of Animal Nutrition and Feed Science,Jilin Province,Jilin Agricultural University,2888 Xincheng Street,Nan-guan District,Changchun 130118,People’Republic of China.
4Department of Animal Science and Technology,College of Animal Bioscience &Technology,Konkuk University,120 Neungdong-ro,Gwangjin-gu,Seoul 143-701,South Korea.5Animal&Dairy Sciences Cluster,College of Agriculture, University of the Philippines Los Ba?ose,Los Ba?os 4031,Laguna,Philippines.
Received:19 June 2014 Accepted:5 March 2015

1.Payne JM.The Compton metabolic profile test.Proc R Soc Med. 1972;65:181-3.
2.Blowey RW,Wood DW,Davis JR.A nutritional monitoring system for dairy herds based on blood glucose,urea and albumin levels.Vet Rec. 1970;92:691-6.
3.Adams RS,Stout WL,Kradel DC,Guss Jr SB,Moser BL,Jung GA.Use and limitations of profiles in assessing health or nutritional status of dairy herds. J Dairy Sci.1978;61:1671-9.
4.Kida K.The metabolic profile test:its practicability in assessing feeding management and periparturient diseases in high yielding commercial dairy herds.J Vet Med Sci.2002;64:557-63.X.
5.Deluyker HA,Gay JM,Weaver JD,Azari AS.Change of milk yield with clinical diseases for a high producing dairy herd.J Dairy Sci.1991;74:436-45.
6.Payne JM,Dew SM,Manston R,Faulks M.The use of a metabolic profile test in dairy herds.Vet Rec.1970;87:150-8.
7.NOSAI,Japan National Agricultural Insurance Association,http://www.nosai.or.jp/.
8.Kida K.Relationships of metabolic profiles to milk production and feeding in dairy cows.J Vet Med Sci.2003;65:671-7.
9.Wee SH,Park SJ.Studies on the pure-bred Korean-native cattle of Chonnam area.Korean J Vet Serv.1990;13:75-9.
10.Ndlovu T,Chimonyo M,Okoh AI,Muchenje V,Dzama K,Raats JG.Assessing the nutritional status of beef cattle:current practices and future prospects. Afri J Biotech.2007;6:2727-34.
11.Lee AJ,Twardock AR,Bubar RH,Hall JE,Davis CL.Blood metabolic profiles: their use and relation to nutritional status of dairy cows.J Dairy Sci. 1978;61:1652-70.
12.Jones GM,Wildman EE,Troutt Jr HF,Lesch TN,Wagner PE,Boman RL. Metabolic profiles in Virginia dairy herds of different milk yields.J Dairy Sci. 1982;65:683-8.
13.Otto F,Baggasse P,Bogin E,Harun M,Vilela F.Biochemical profile of Angoni cattle in Mozambique.Israel Vet Med Assoc.2000;55:1-9.
*Correspondence:cyjcow@snu.ac.kr;hglee66@konkuk.ac.kr
1Laboratory of Animal Cell Biotechnology,Department of Agricultural
Biotechnology,Seoul National University,Shinlim-dong,Kwanak-gu,Seoul 151-742,South Korea
4Department of Animal Science and Technology,College of Animal Bioscience &Technology,Konkuk University,120 Neungdong-ro,Gwangjin-gu,Seoul 143-701,South Korea
Full list of author information is available at the end of the article
 Journal of Animal Science and Biotechnology2015年2期
- Journal of Animal Science and Biotechnology的其它文章
- PREFACE
- Impact of source tissue and ex vivo expansion on the characterization of goat mesenchymal stem cells
- Changes in fetal mannose and other carbohydrates induced by a maternal insulin infusion in pregnant sheep
- Calcium potentiates the effect of estradiol on PGF2α production in the bovine endometrium
- Factors controlling nutrient availability to the developing fetus in ruminants
- Current strategies for reproductive management of gilts and sows in North America
