Investigating fatigue behavior of gear components with the acoustic emission technique
SHI Peng-fei(石鵬飛), HUANG Jie(黃杰)
(1.School of Mechanical Engineering, Beijing Institute of Technology, Beijing 100081, China; 2.The Second Research Institute of China Electronics Technology Group Corporation, Taiyuan 030024, China)
Investigating fatigue behavior of gear components with the acoustic emission technique
SHI Peng-fei(石鵬飛)1,2, HUANG Jie(黃杰)
(1.School of Mechanical Engineering, Beijing Institute of Technology, Beijing 100081, China; 2.The Second Research Institute of China Electronics Technology Group Corporation, Taiyuan 030024, China)
A novel method is presented to evaluate the complicated fatigue behavior of gears made of 20Cr2Ni4A. Fatigue tests are conducted in a high-frequency push-pull fatigue tester, and acoustic emission (AE) technique is used to acquire metal fatigue signals. After analyzing large number of AE frequency spectrum, we find that: the crack extension can be expressed as the energy of specific frequency band, which is abbreviated as F-energy. To further validate the fatigue behavior, some correlation analysis is applied between F-energy and some AE parameters. Experimental results show that there is significant correlation among the F-energy, root mean square (RMS), relative energy, and hits. The findings can be used to validate the effectiveness of the F-energy in predicting fatigue crack propagation and remaining life for parts in-service. F-energy, as a new AE parameter, is first put forward in the area of fatigue crack growth.
acoustic emission; fatigue crack growth; multiple cracks; life prediction; damage accumulation
Metal parts are subjected to fatigue in their service lives. The application of alternate loading, environmental factor and the ageing of structure may all cause fatigue cracks. Fatigue problems in mechanical, aerospace, civil construction and other industries will bring huge damages if without any prior warning. Hence, the critical issue is how to assess fatigue crack extension of the parts effectively.
In the past five decades, acoustic emission (AE) has been widely used as an effective non-destructive technique to monitor fatigue cracks of metal components in structures such as aircraft[1-2], steel bridges[3-4], pipelines and pressure vessels[5]. AE are essentially elastic stress waves, generated by a rapid release of energy from a localized source within a stressed material[6-7].
Research findings of metal fatigue crack extension are mainly in two aspects at present. First, describe the fatigue damage process of varieties of parts using hits rate, counts rate, and relative energy rate. Crack closure of LY12CZ aluminum alloy during fatigue process and correlation between AE and crack growth in landing gears using AE parameters were investigated[8-9]. Second, calculate the crack growth rate of certain specimen using empirical equation, which is similar to Paris-Erdogan equation[10]. Researchers have developed different theoretical models to simulate crack growth rate for fatigue life prediction. Jianguo Yu and Paul Ziehl argued AE relative energy rate may be more reasonable than AE counts rate[4]. Moreover, Refahi Oskouei and Zucchelli used cumulative AE event energy, too[11].
However, relative energy or other AE parameters are too subjective and these parameters are affected by the value of threshold[12-13]. Moreover, the previous studies performed fatigue experiments using standard specimens with pre-crack and actual parts were used barely[14-15]. Almost nobody takes actual parts to perform fatigue test because it is difficult to measure micro and macro cracks. While significant work has been directed at standard specimens to describe the fatigue cracks propagation, significantly less effort has been placed on method for actual parts. In this study a new fatigue damage evaluation methodology for actual gears is applied to describe its complicated fatigue behavior. The next section presents the AE energy formula on specific frequency range, which is abbreviated as F-energy. Then, the bending fatigue test and AE monitoring procedures are described in section 2. The trends of the F-energy in comparison to RMS, relative energy and hits together with the correlation analysis demonstrate that it can describe the fatigue behavior of testing gears effectively.
1 Theoretical model
1.1 Theoretical analysis
Common practice suggests that defects exist in surface and internal area of metal materials, and stress highly centralizes at alternating load region. Consequently, elastic energy of crack extension is released dramatically in the form of acoustic wave. Previous studies argued that an AE wave is similar to a damped real sinusoid[16]. In fact, AE signals acquired are a superposition of multiple event sources, and can be expressed as
(1)
whereVis instantaneous voltage,Viis the peak of AE event, βiistheattenuationfactor,andωiistheAEeventfrequency.Eq.(1)showsthatAEsignalsofcrackgrowthhaveabundantanddifferentωi.Therefore,thecharacteristicparametertodescribefatiguebehaviormustbeafunctionoffrequencies.
1.2F-energycomputationmethod
EnergyofAEsignalwithonlyonesourcesatisfies:
(2)
wherefis time domain signals,Fis frequency domain signals after fast Fourier transform. If specific frequency for fatigue cracks extension ranges from ωdtoωu,theenergyis
(3)
TheF-energy,superposedbymultipleAEsources,canbecalculatedby
(4)
whereFestands for F-energy.
For fatigue testin next section, frequencies from ωdtoωustandforthespecificfrequencyrangeoffatiguecracksextension.AfterprocessinghugeAEsignalsandstatisticalanalysis,thevaluesofωdandωuwillbeacquired.TheF-energyisequivalenttoenergyofAEsignalsaftertheband-passfilter.Previousfindingssupporttheviewpointthatrelativeenergycouldrepresentfatiguebehaviorofmetalpartsaswell.However,relativeenergy,comparedwiththeF-energy,mayincludemanynoises.Sothenewparameter,F-energy,maydescribefatiguebehaviorofactualpartstrulyandvalidly.
2 Experimentaldetails
2.1Bendingfatiguetestprocedures
FatiguetestwasperformedonaLG-300CfatiguetestingmachinemadeinChinawithsinusoidalloadatstressratio, R,andfrequencyof100Hzinambientlaboratoryair(temperature: 20 ℃).Alltestinggearsweresuppliedinthestandardheattreatmentconditionandwiththesamechemicalcompositionsof20Cr2Ni4A.Thebiggestdifferencefrompreviousexperimentalconditionisthatalltestinggearsareactualcomponents.Andthetestinggearwassetatspecificfixture,whichislikethethreadedconnection.Wetooksevengearstoperformfatiguetestandallofthemhadbrokenteethattheendoftest.TheloadingparametersaregiveninTab.1,whereFaistheappliedalternantload,andFmistheappliedmeanload.
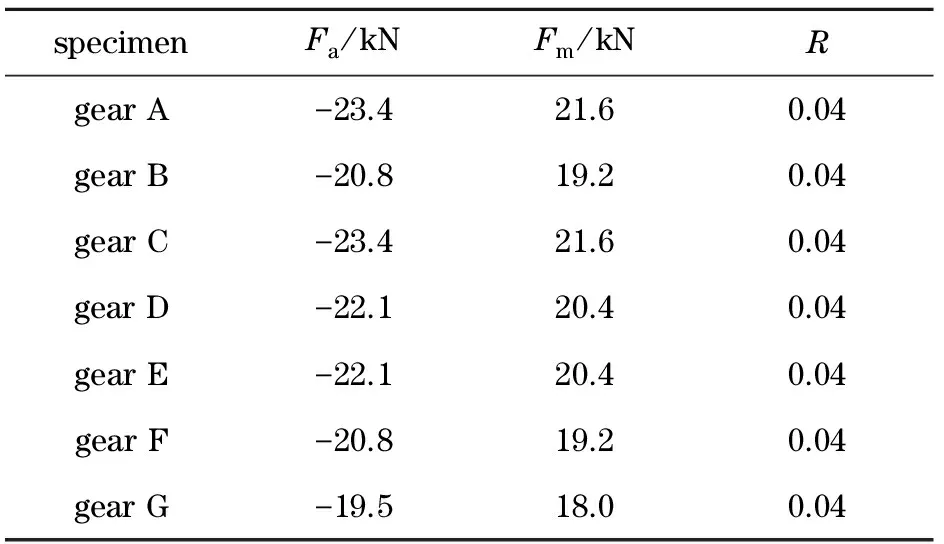
Tab.1 Value ofFa,FmandR
2.2 Acoustic emission monitoring
The instrument designed by Physical Acoustic Corporation(USA) was employed to detect and record AE signals. A preamplifier with 40 dB gain and a band-pass filter were used to acquire AE signals associated with fatigue crack extension. The AE data was captured and displayed through a 2-channel AEWIN for PCI-2 system. Sample rate was set at 2 Msps. The threshold of each AE channel was 60 dB (hits below the specified amplitude are not recorded). In this condition, extraneous noise is minimized and genuine AE data still allow for collection.
2.3 Noise analysis
There are two kinds of background noise. One is mechanical noise, which is caused by impact or friction between objects. Another one is electromagnetic noise, which is due to electrostatic induction or electromagnetic induction. The AE signals, which are different from noise, are mainly in two aspects. The frequency band of AE signals for metal fatigue is between 110 kHz-550 kHz, but noise is below 100 Hz. And waves of the two have big different, too. Therefore, we can obtain specific frequency range for fatigue clearly.
3 Discussion and results
3.1 Acquiring specific frequency range
In this section, specific frequency range will be acquired from analysis of theoretical mode in section 1 and experimental AE data in section 2. Fig.1 and Fig.2 show the AE time domain and frequency domain signals of typical fatigue crack propagation. The amplitude makes an instantaneous jump at about 420 μs, when the amplitude approaches to 0.02 V, as illustrated in Fig.1. From Fig.2, the amplitude centralizes mainly between 100 kHz and 400 kHz. So we may draw a preliminary conclusion: the specific frequency band of gear bending fatigue crack growth is about 100 kHz-400 kHz. Previous research also shows that AE signals of fatigue crack propagation or fracture of general metal materials are a kind of band-width signals.

Fig.1 Time domain wave of crack extension
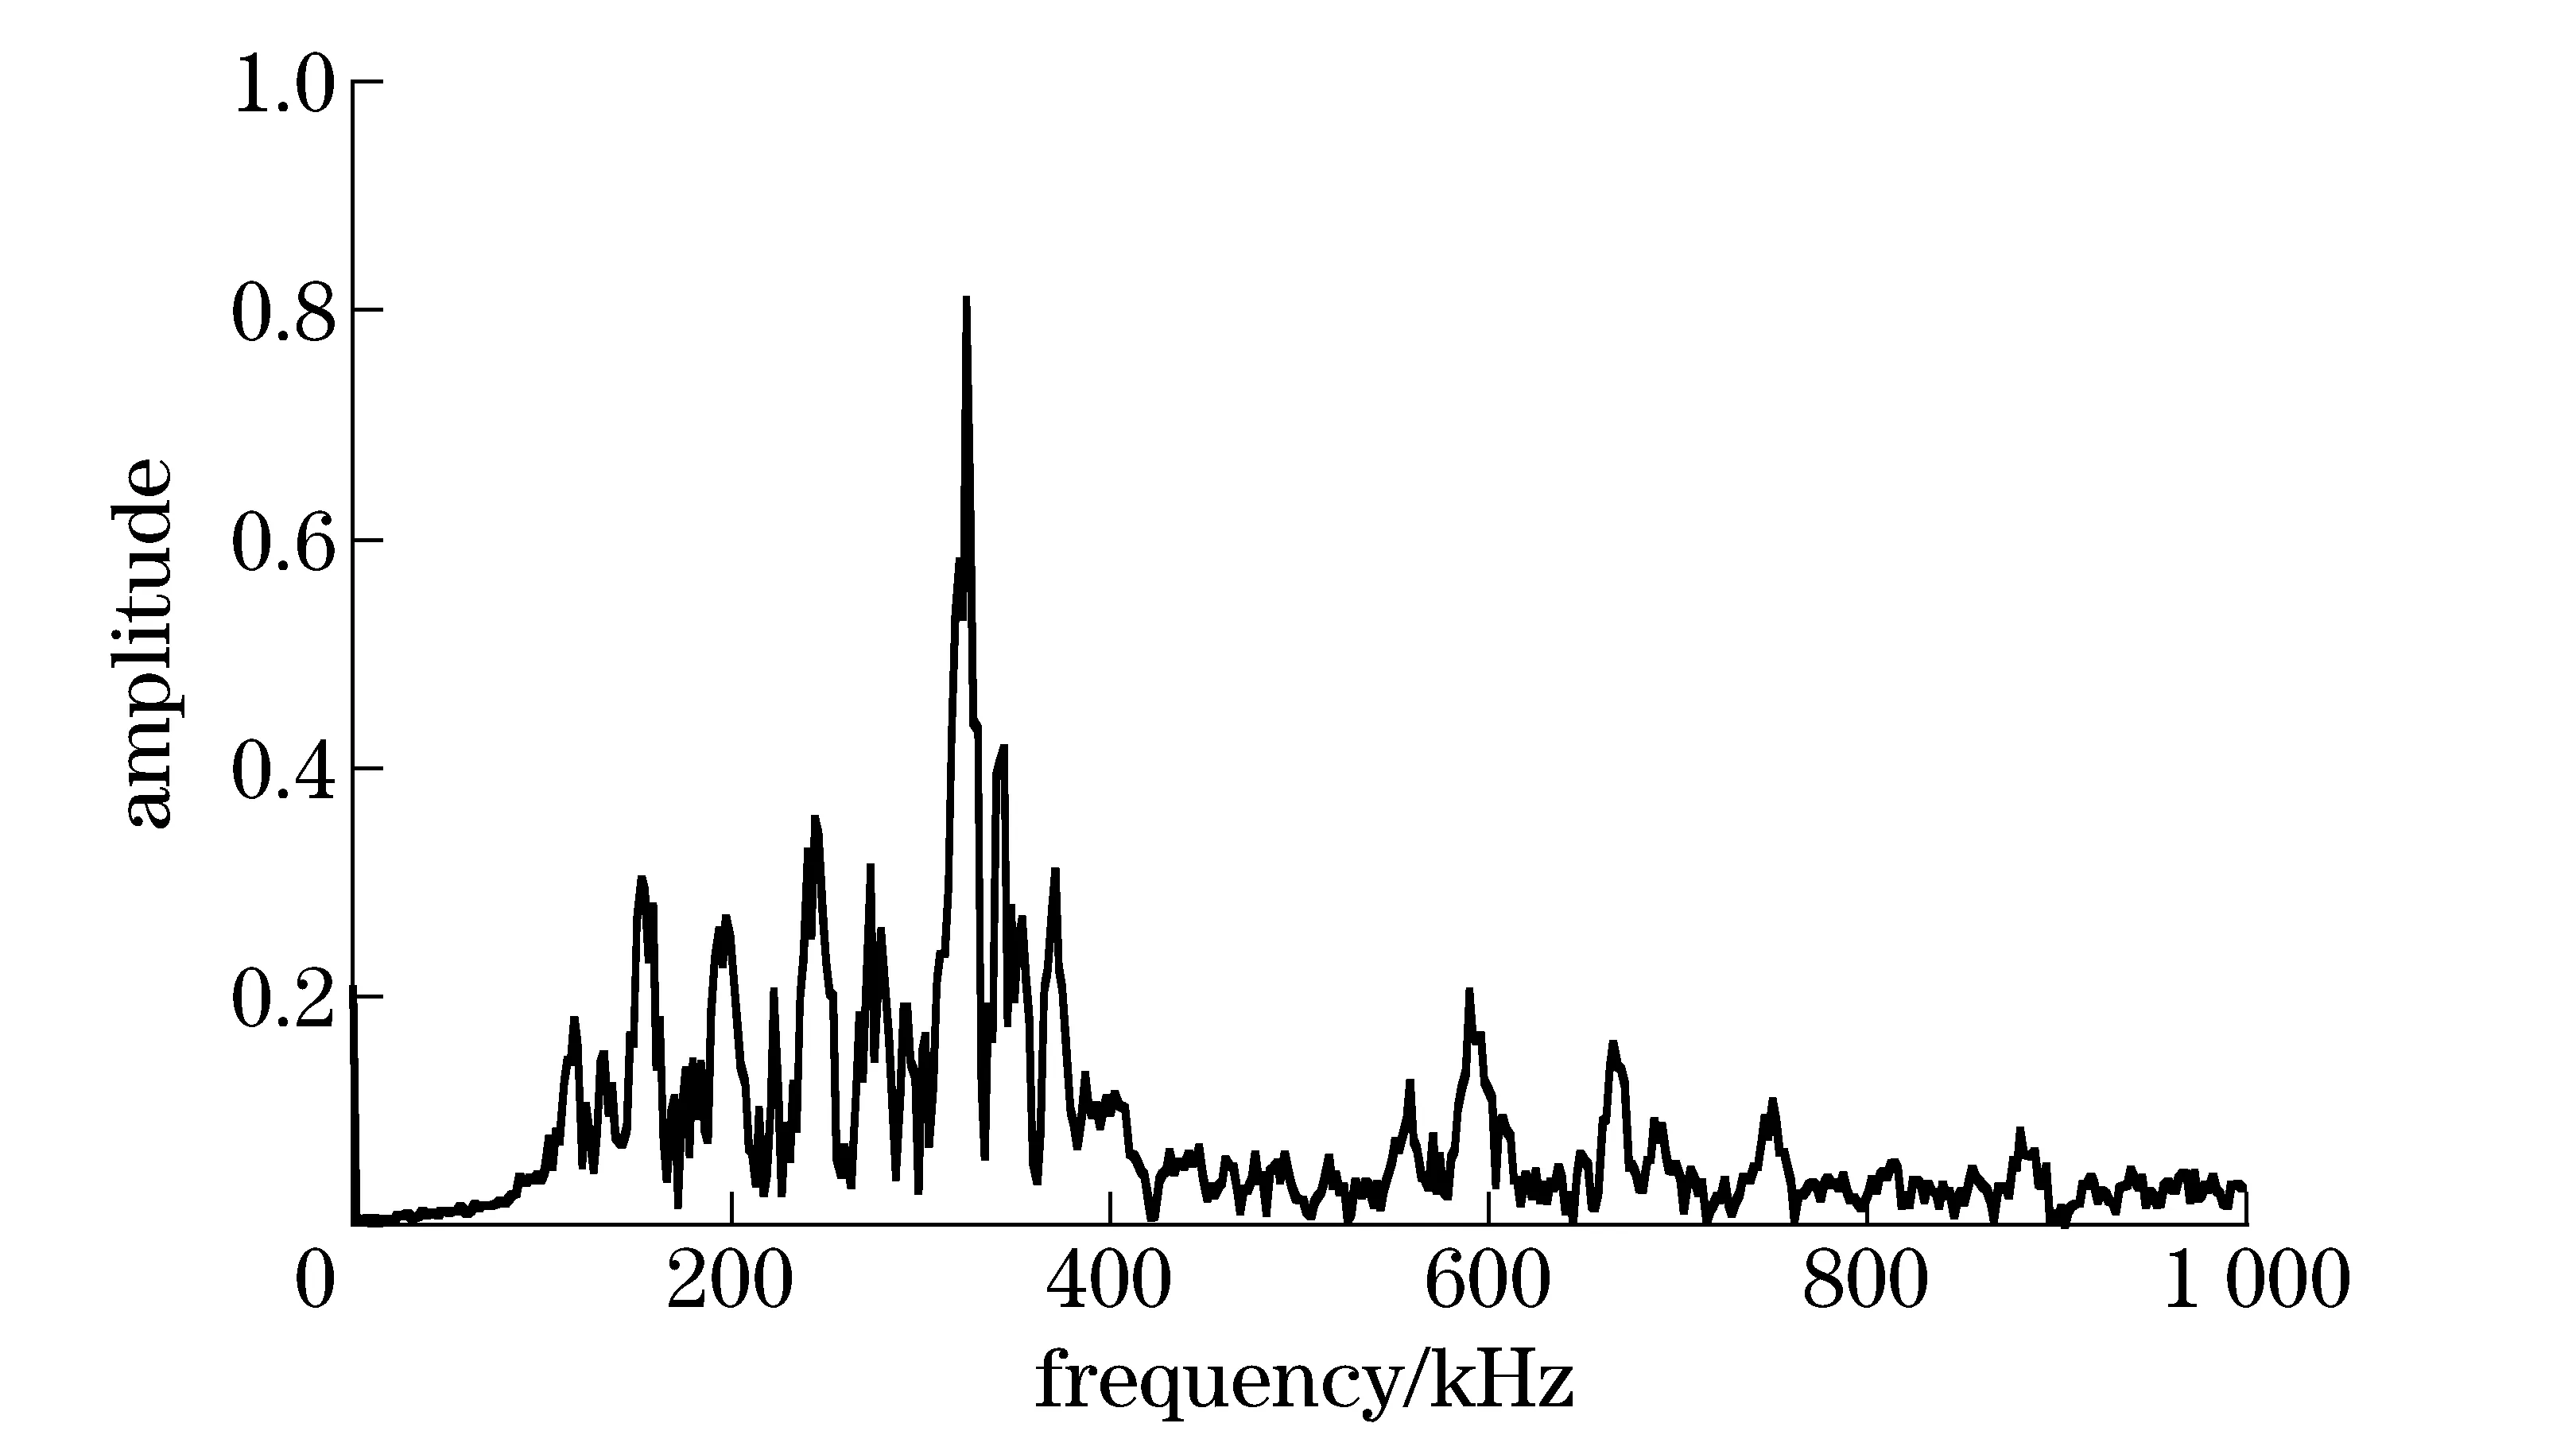
Fig.2 Frequency domain wave of crack extension
To acquire the specific frequency range accurately, all AE hits (almost 9 000) of gear B are averaged up in the frequency domain, as illustrated in Fig.3. The blue line represents 2% of maximum power. From the viewpoint in vibration, the value less than 2% or 5% of peak vibration could be considered as zero. The area above the blue line accounts for around 79% of total. This zone includes most of energy and contains all fatigue information as well. So we know that the energy of frequency in this frequency range could be used to describe fatigue cracks growth of gears effectively. Points of intersection between the power spectrum curve and the blue line belongs to the specific frequency range. If we apply this method to other gears, more accurate specific frequency band, which ranges from 116 kHz to 356 kHz, will be obtained.
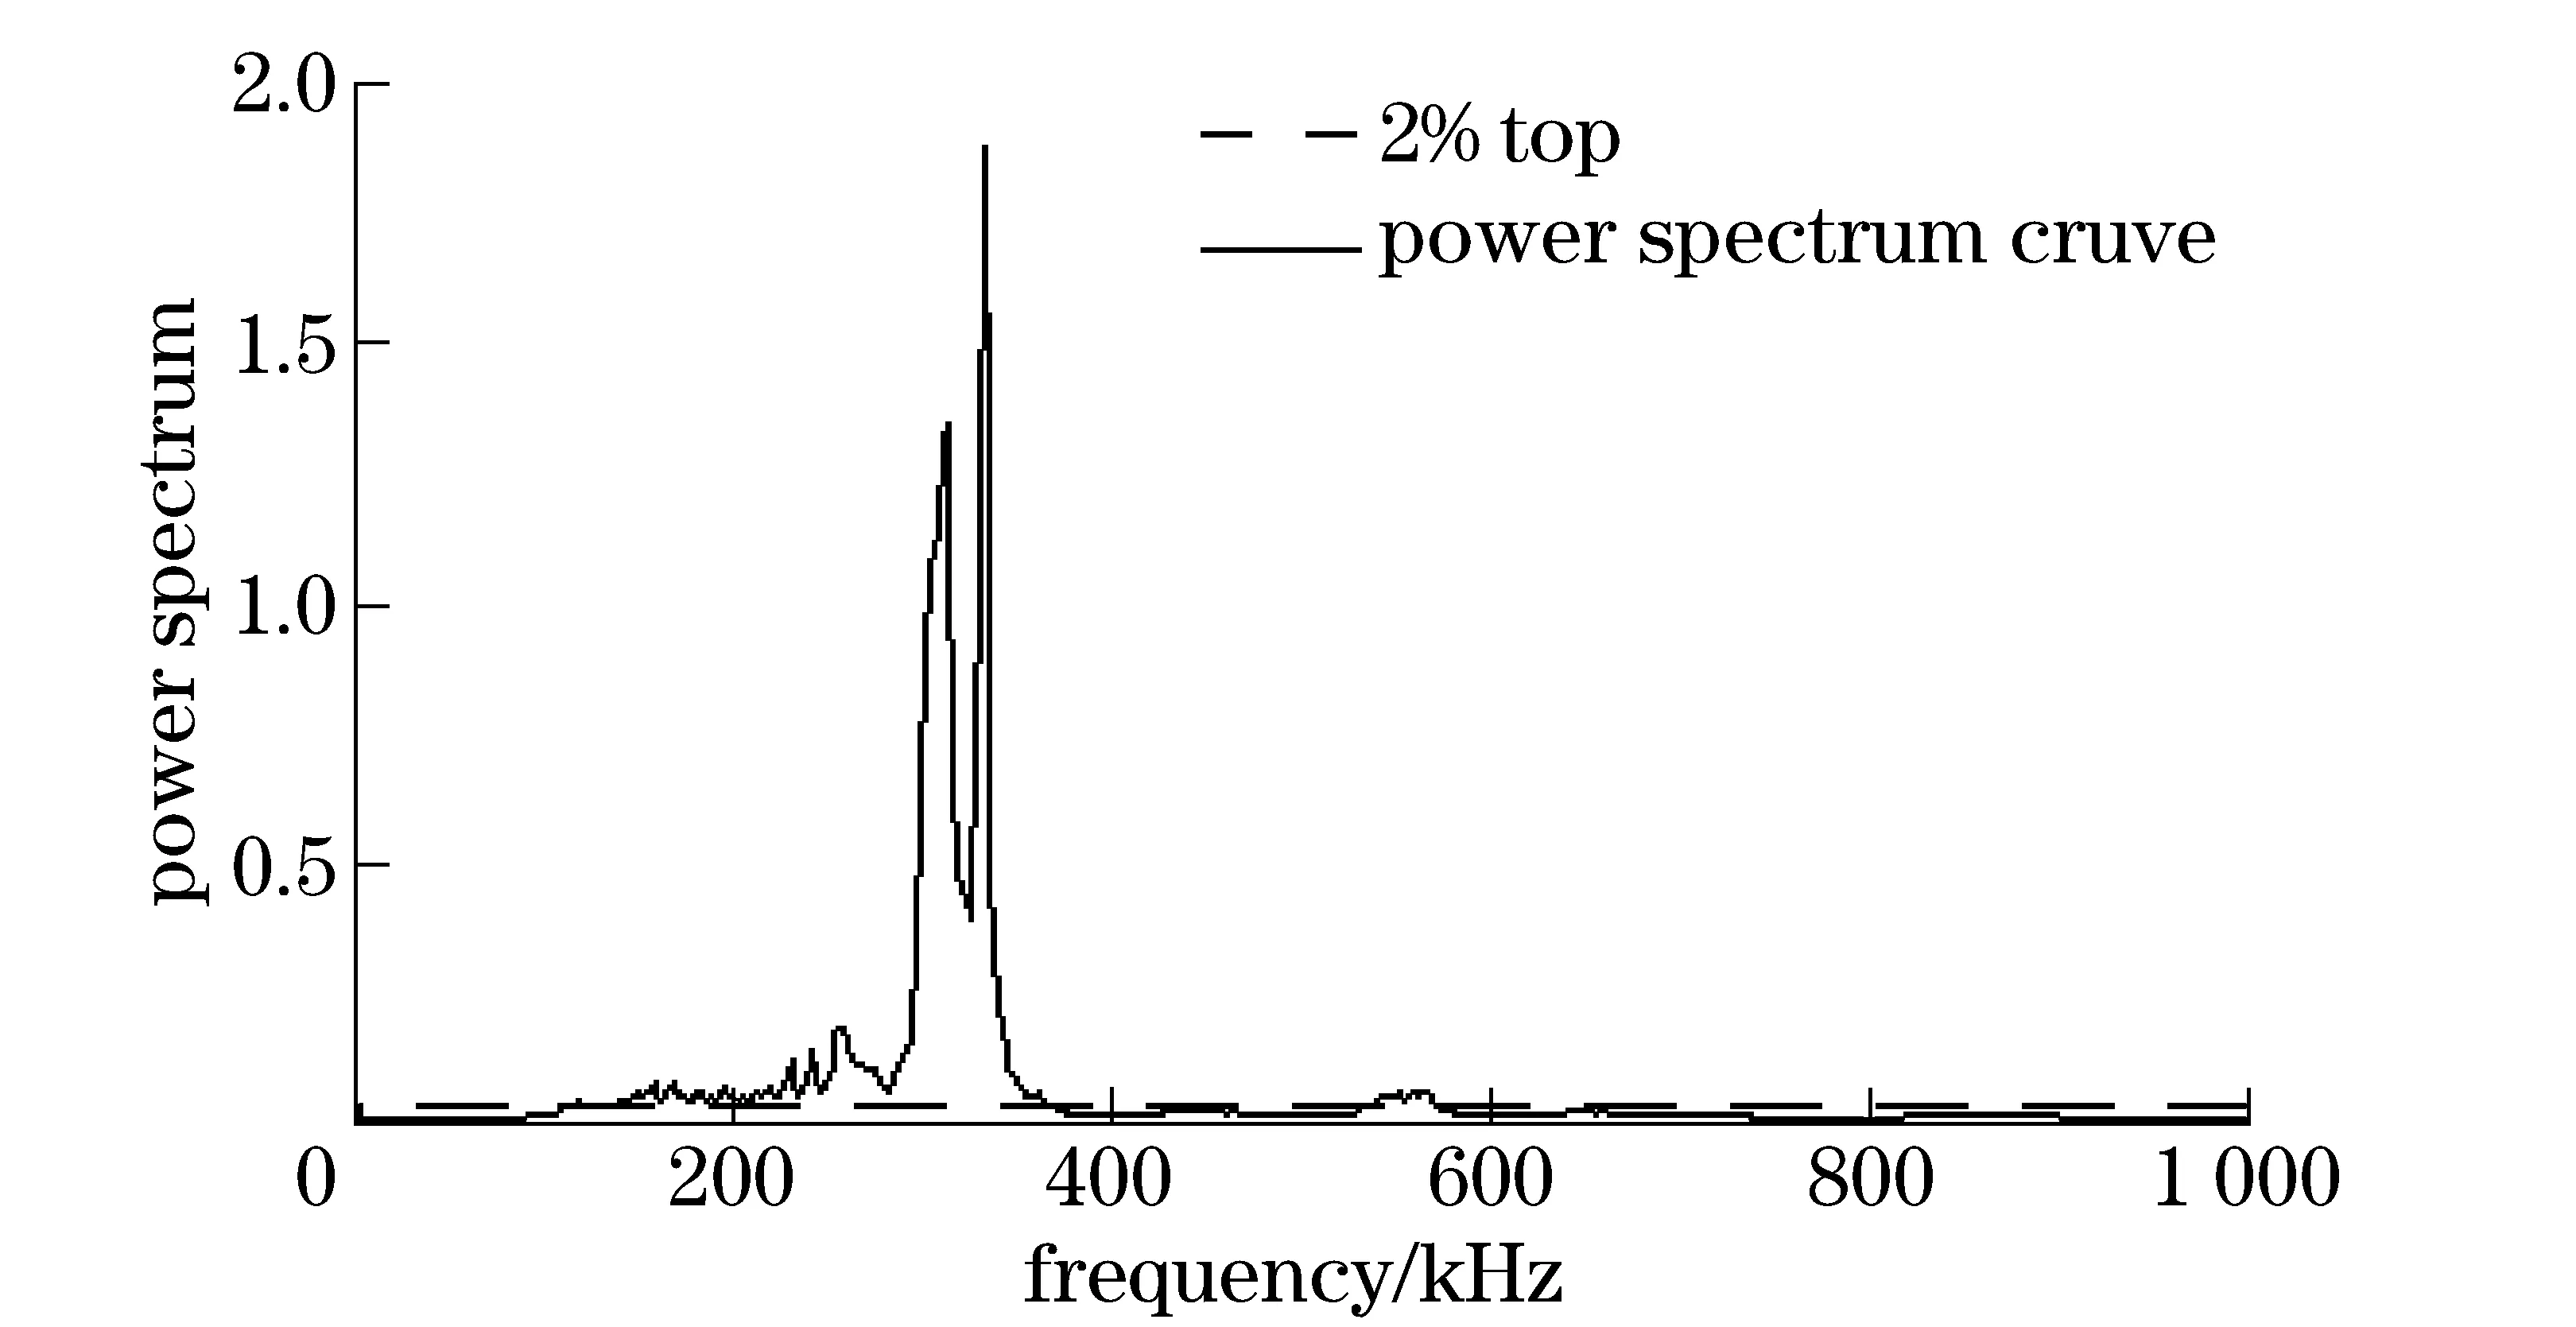
Fig.3 Average power of gear B
3.2 Description of fatigue crack propagation
The most widely used AE signal parameters are hits, counts, amplitude, relative energy, RMS, duration and rising time[17]. And the characteristics of AE are useful for damage evaluation of in-service parts in previous research. The critical period which can indicate crack growth from the stage of stable propagation to the stage of unstable propagation may be easily obtained by the trend of AE parameters.
Accumulated RMS, relative energy, hits and F-energy are displayed in Figs.4-5 for gear A, and in Figs.6-7 for gear B. The F-energy follows extremely similar trends to RMS, relative energy and hits as the load time increase both for gear A and B. Note that the accumulated F-energy, RMS, relative energy and hits determine the same critical period of crack propagation. For gear A, the critical period is from 1 714 s to 1 767 s. Before 1 714 s, the four parameters increase steady and after 1 767 s, the four increase rather dramatically. For gear B, the critical period is from 1 585 s to 2 332 s. Before 1 585 s, the four characteristic values increase steady and after 2 332 s, the four grow rather dramatically. The trends of the four parameters for gears C, D, E, F and G are not given because the situations are exactly alike.
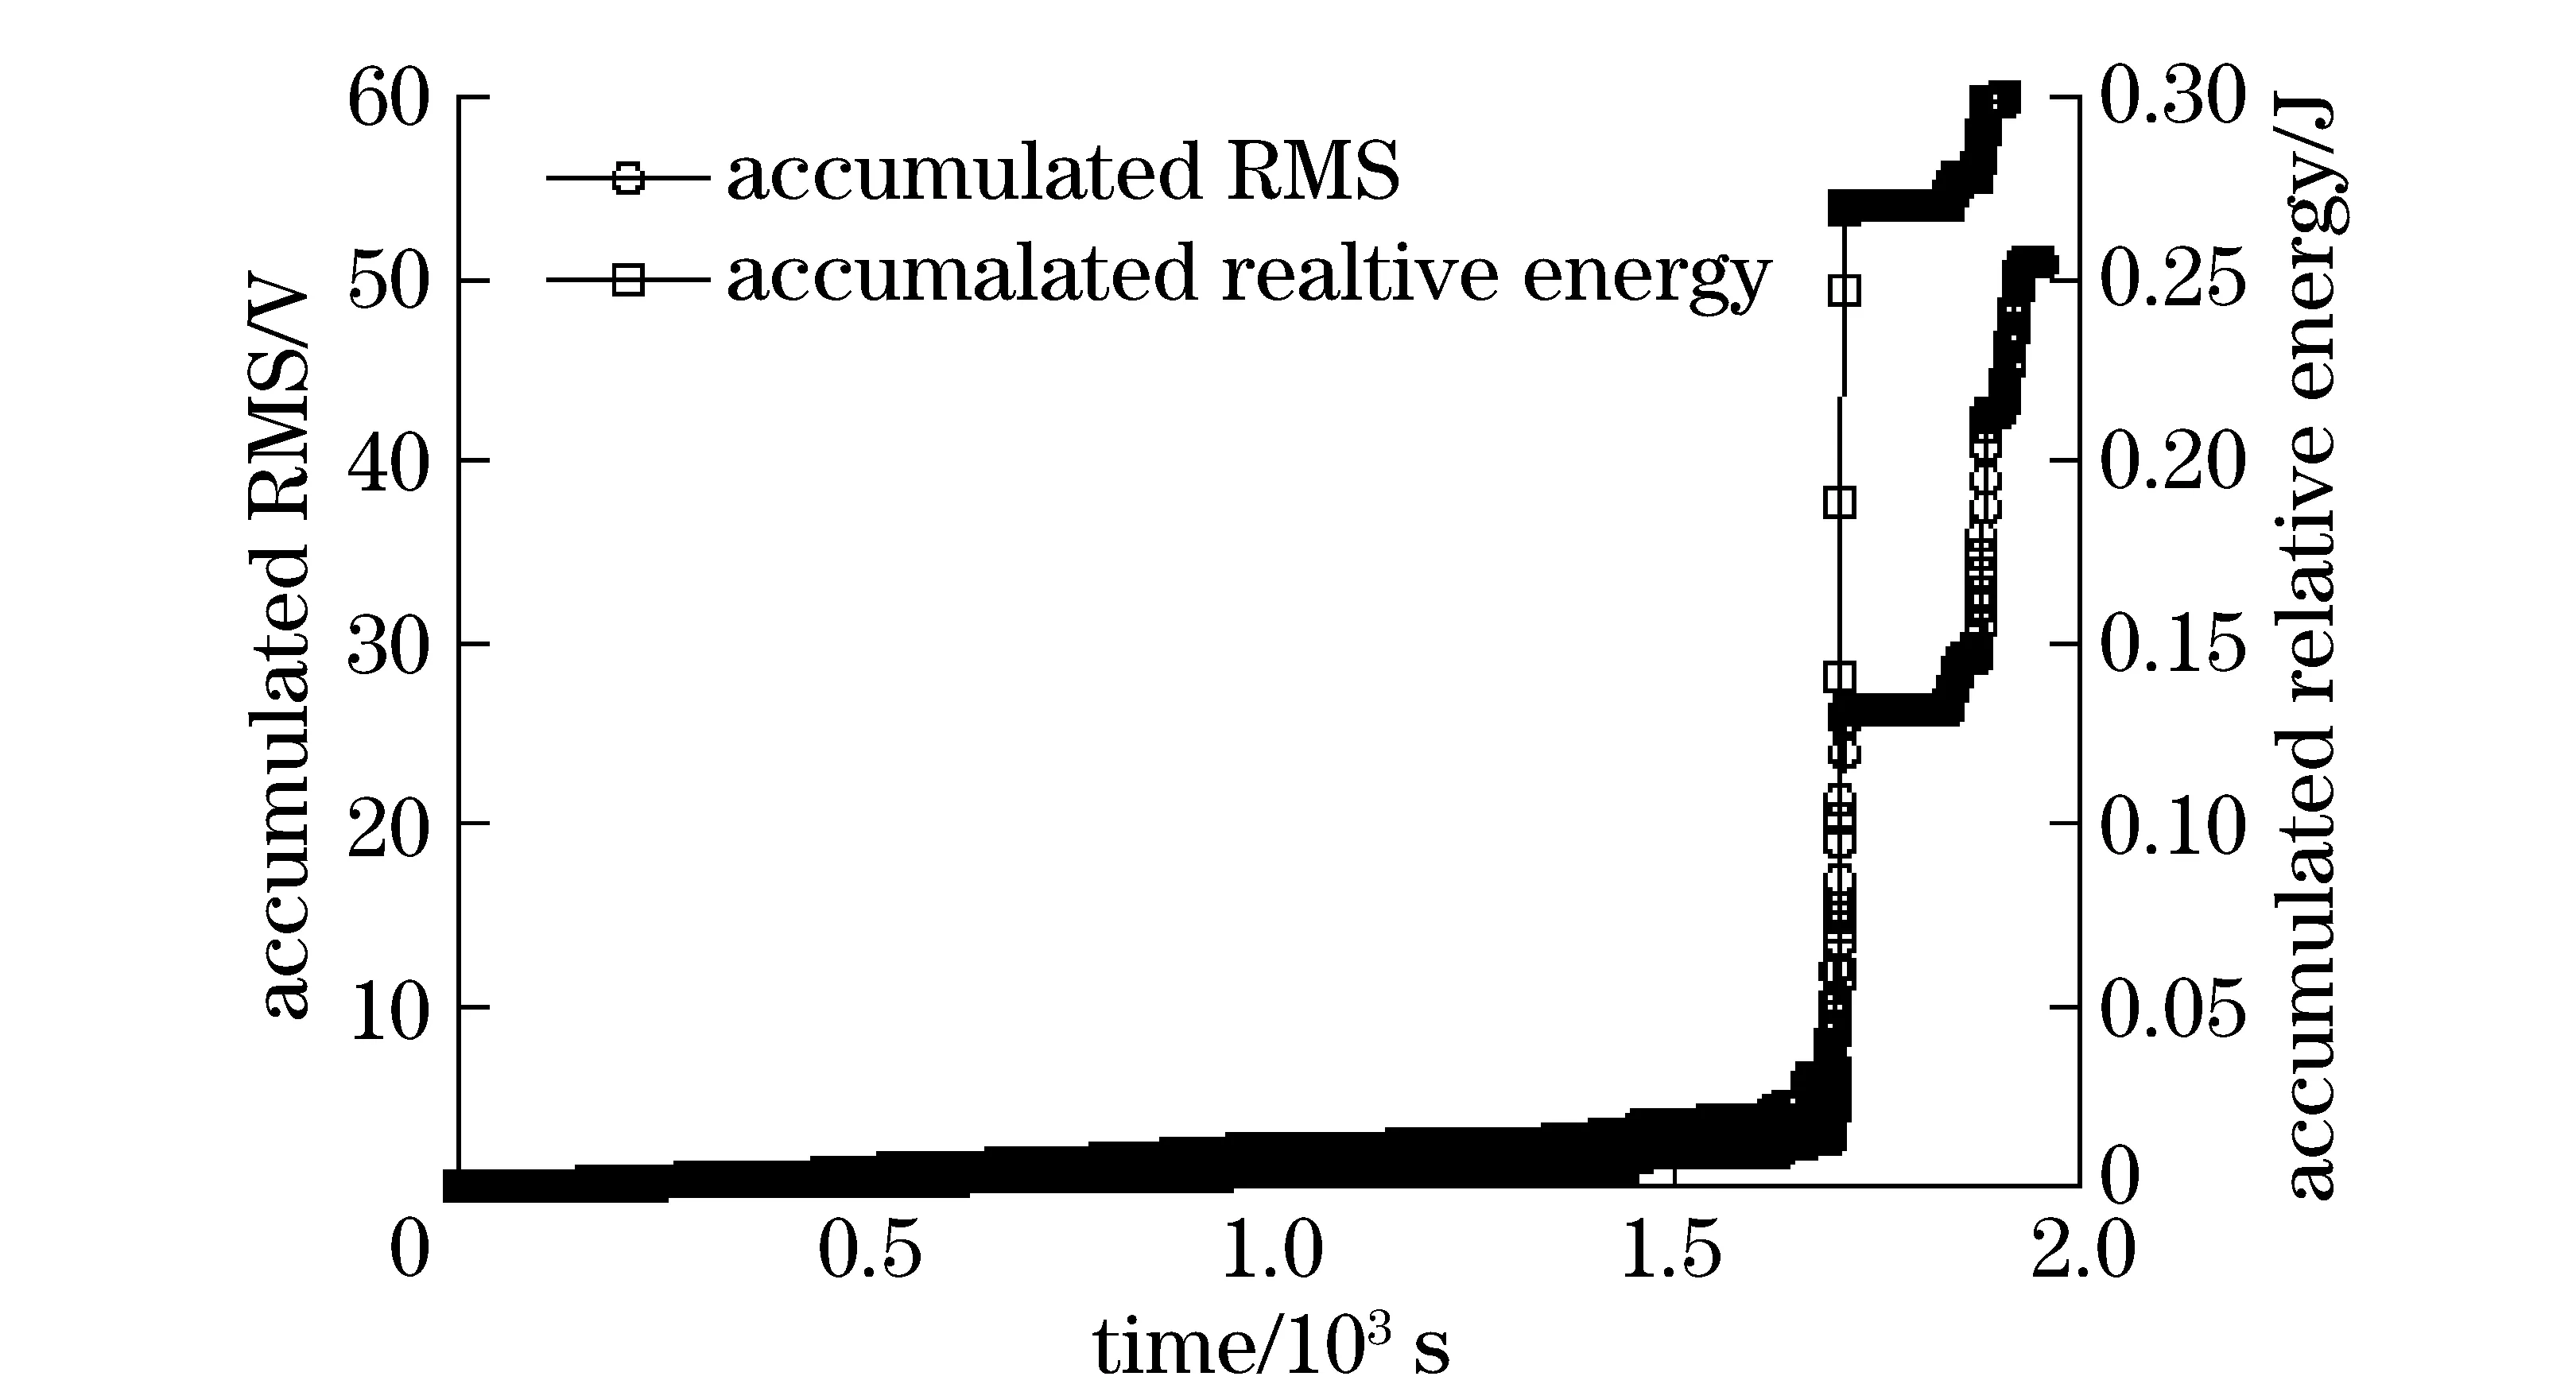
Fig.4 Two parameters of AE signals for gear A
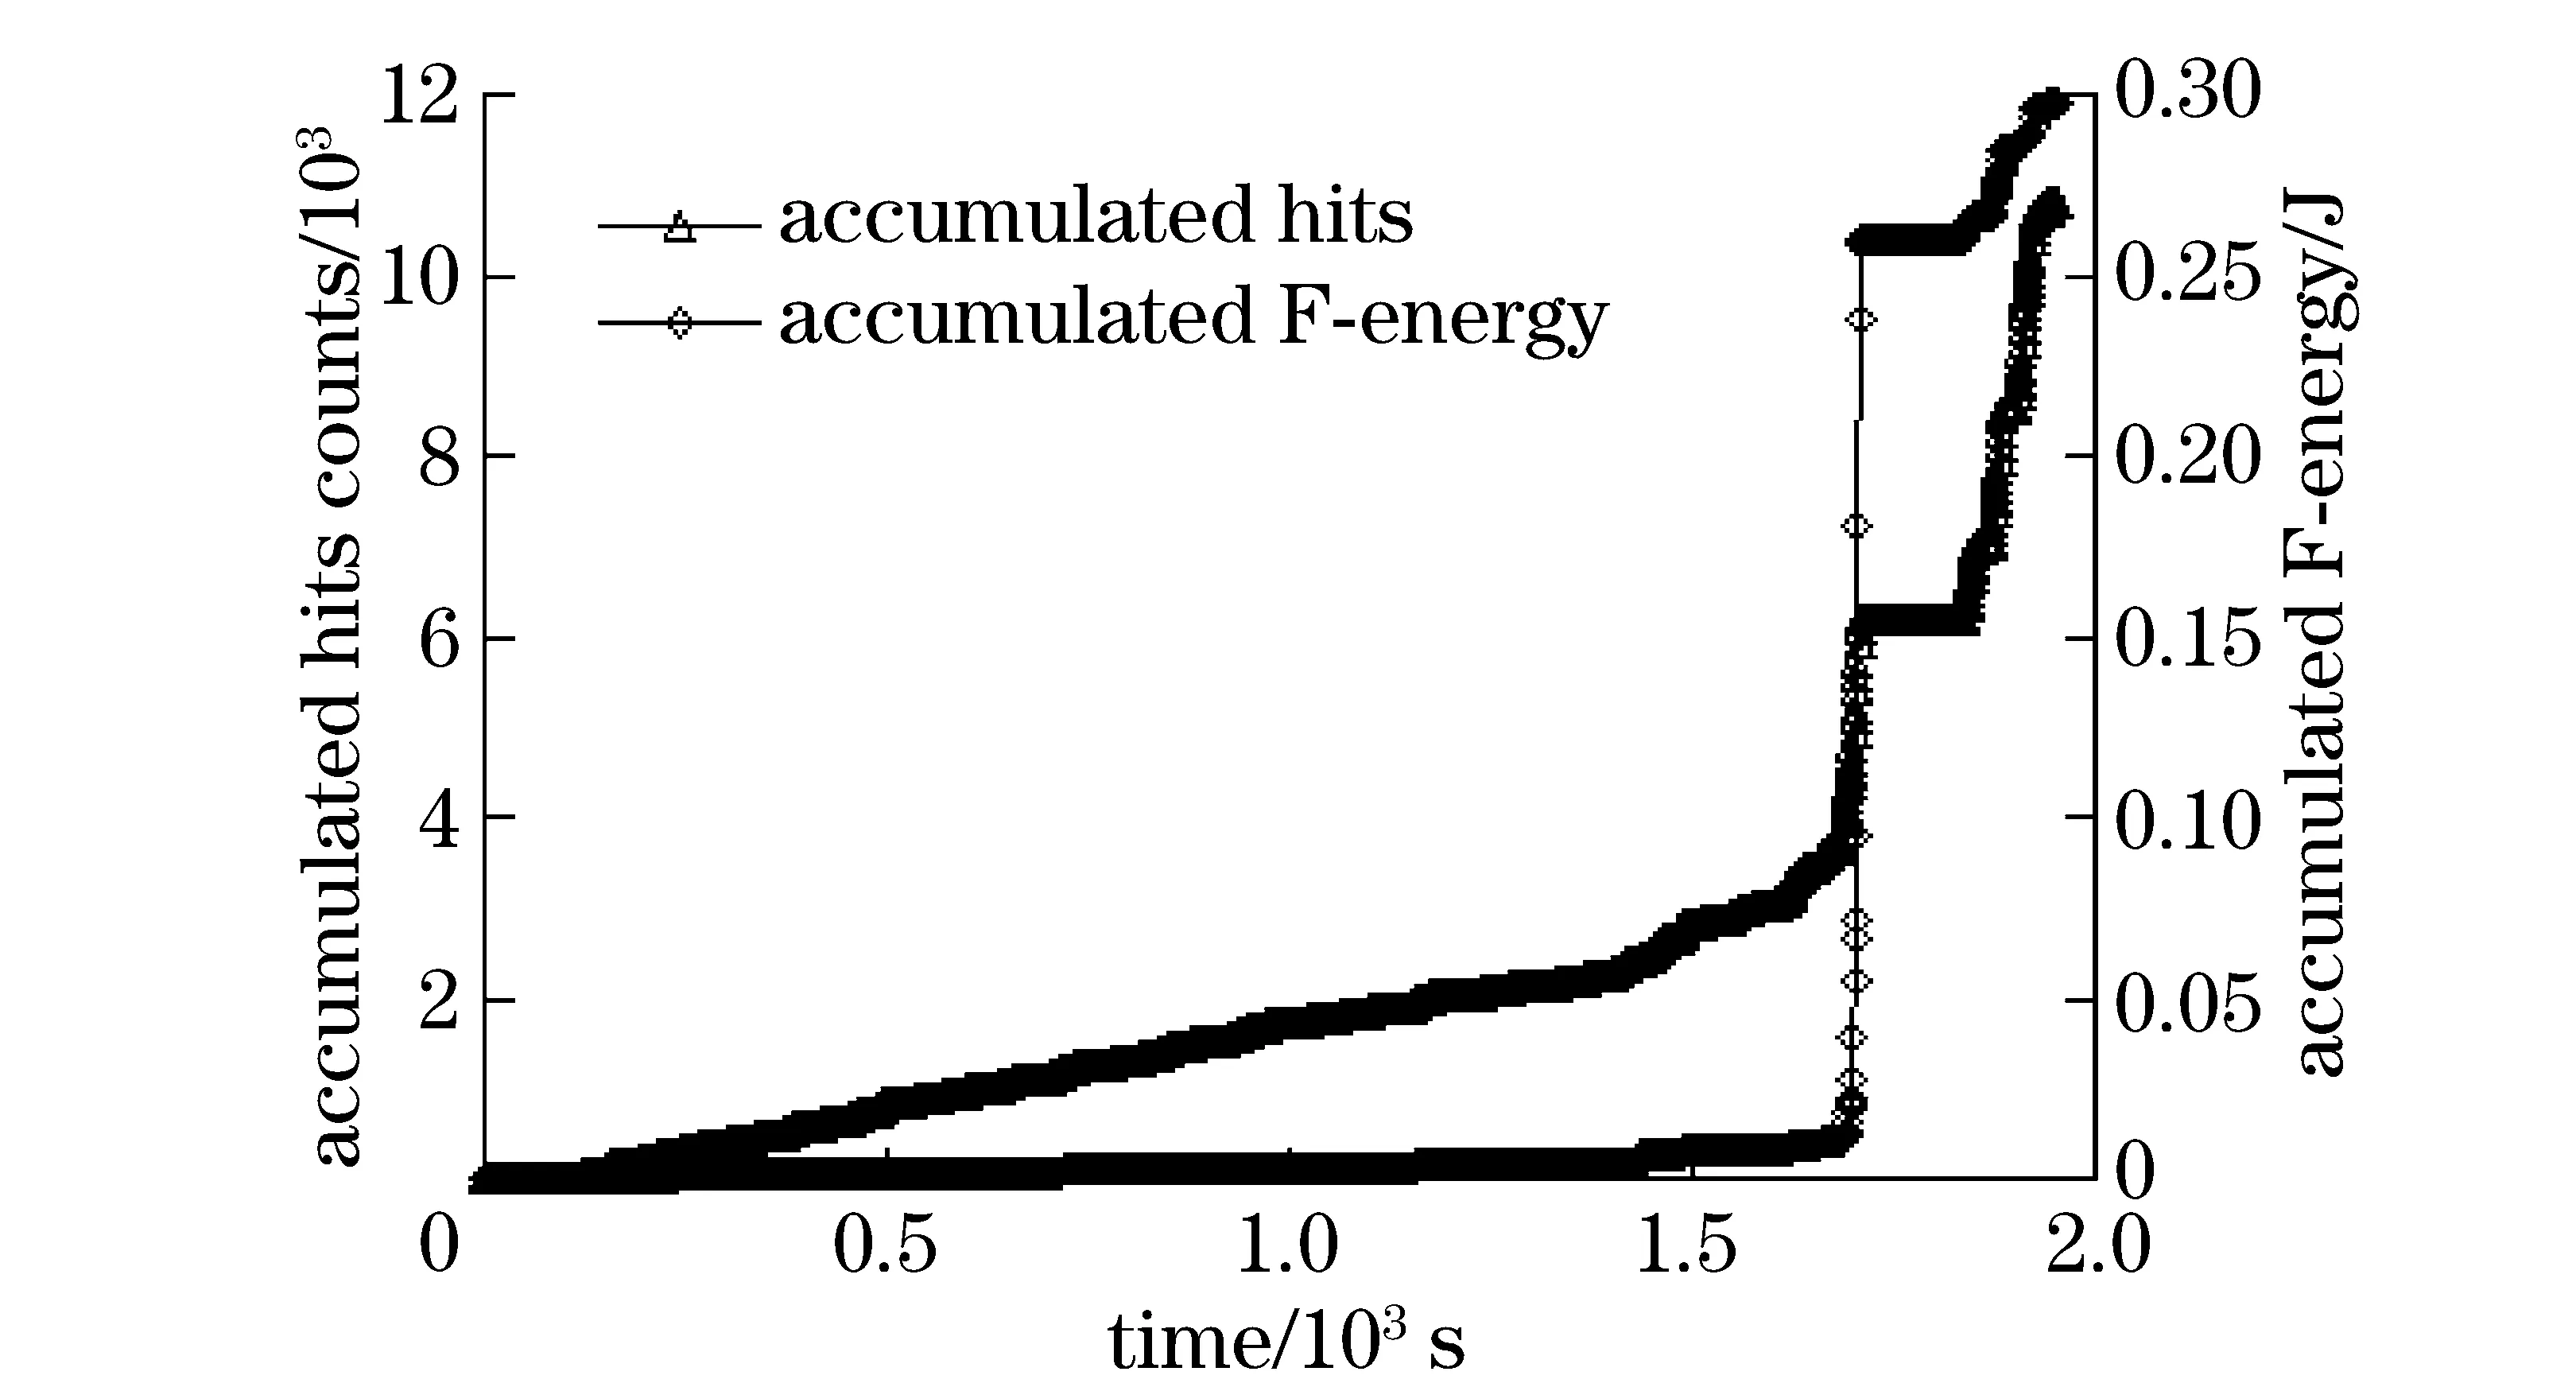
Fig.5 Another two parameters of AE signals for gear A
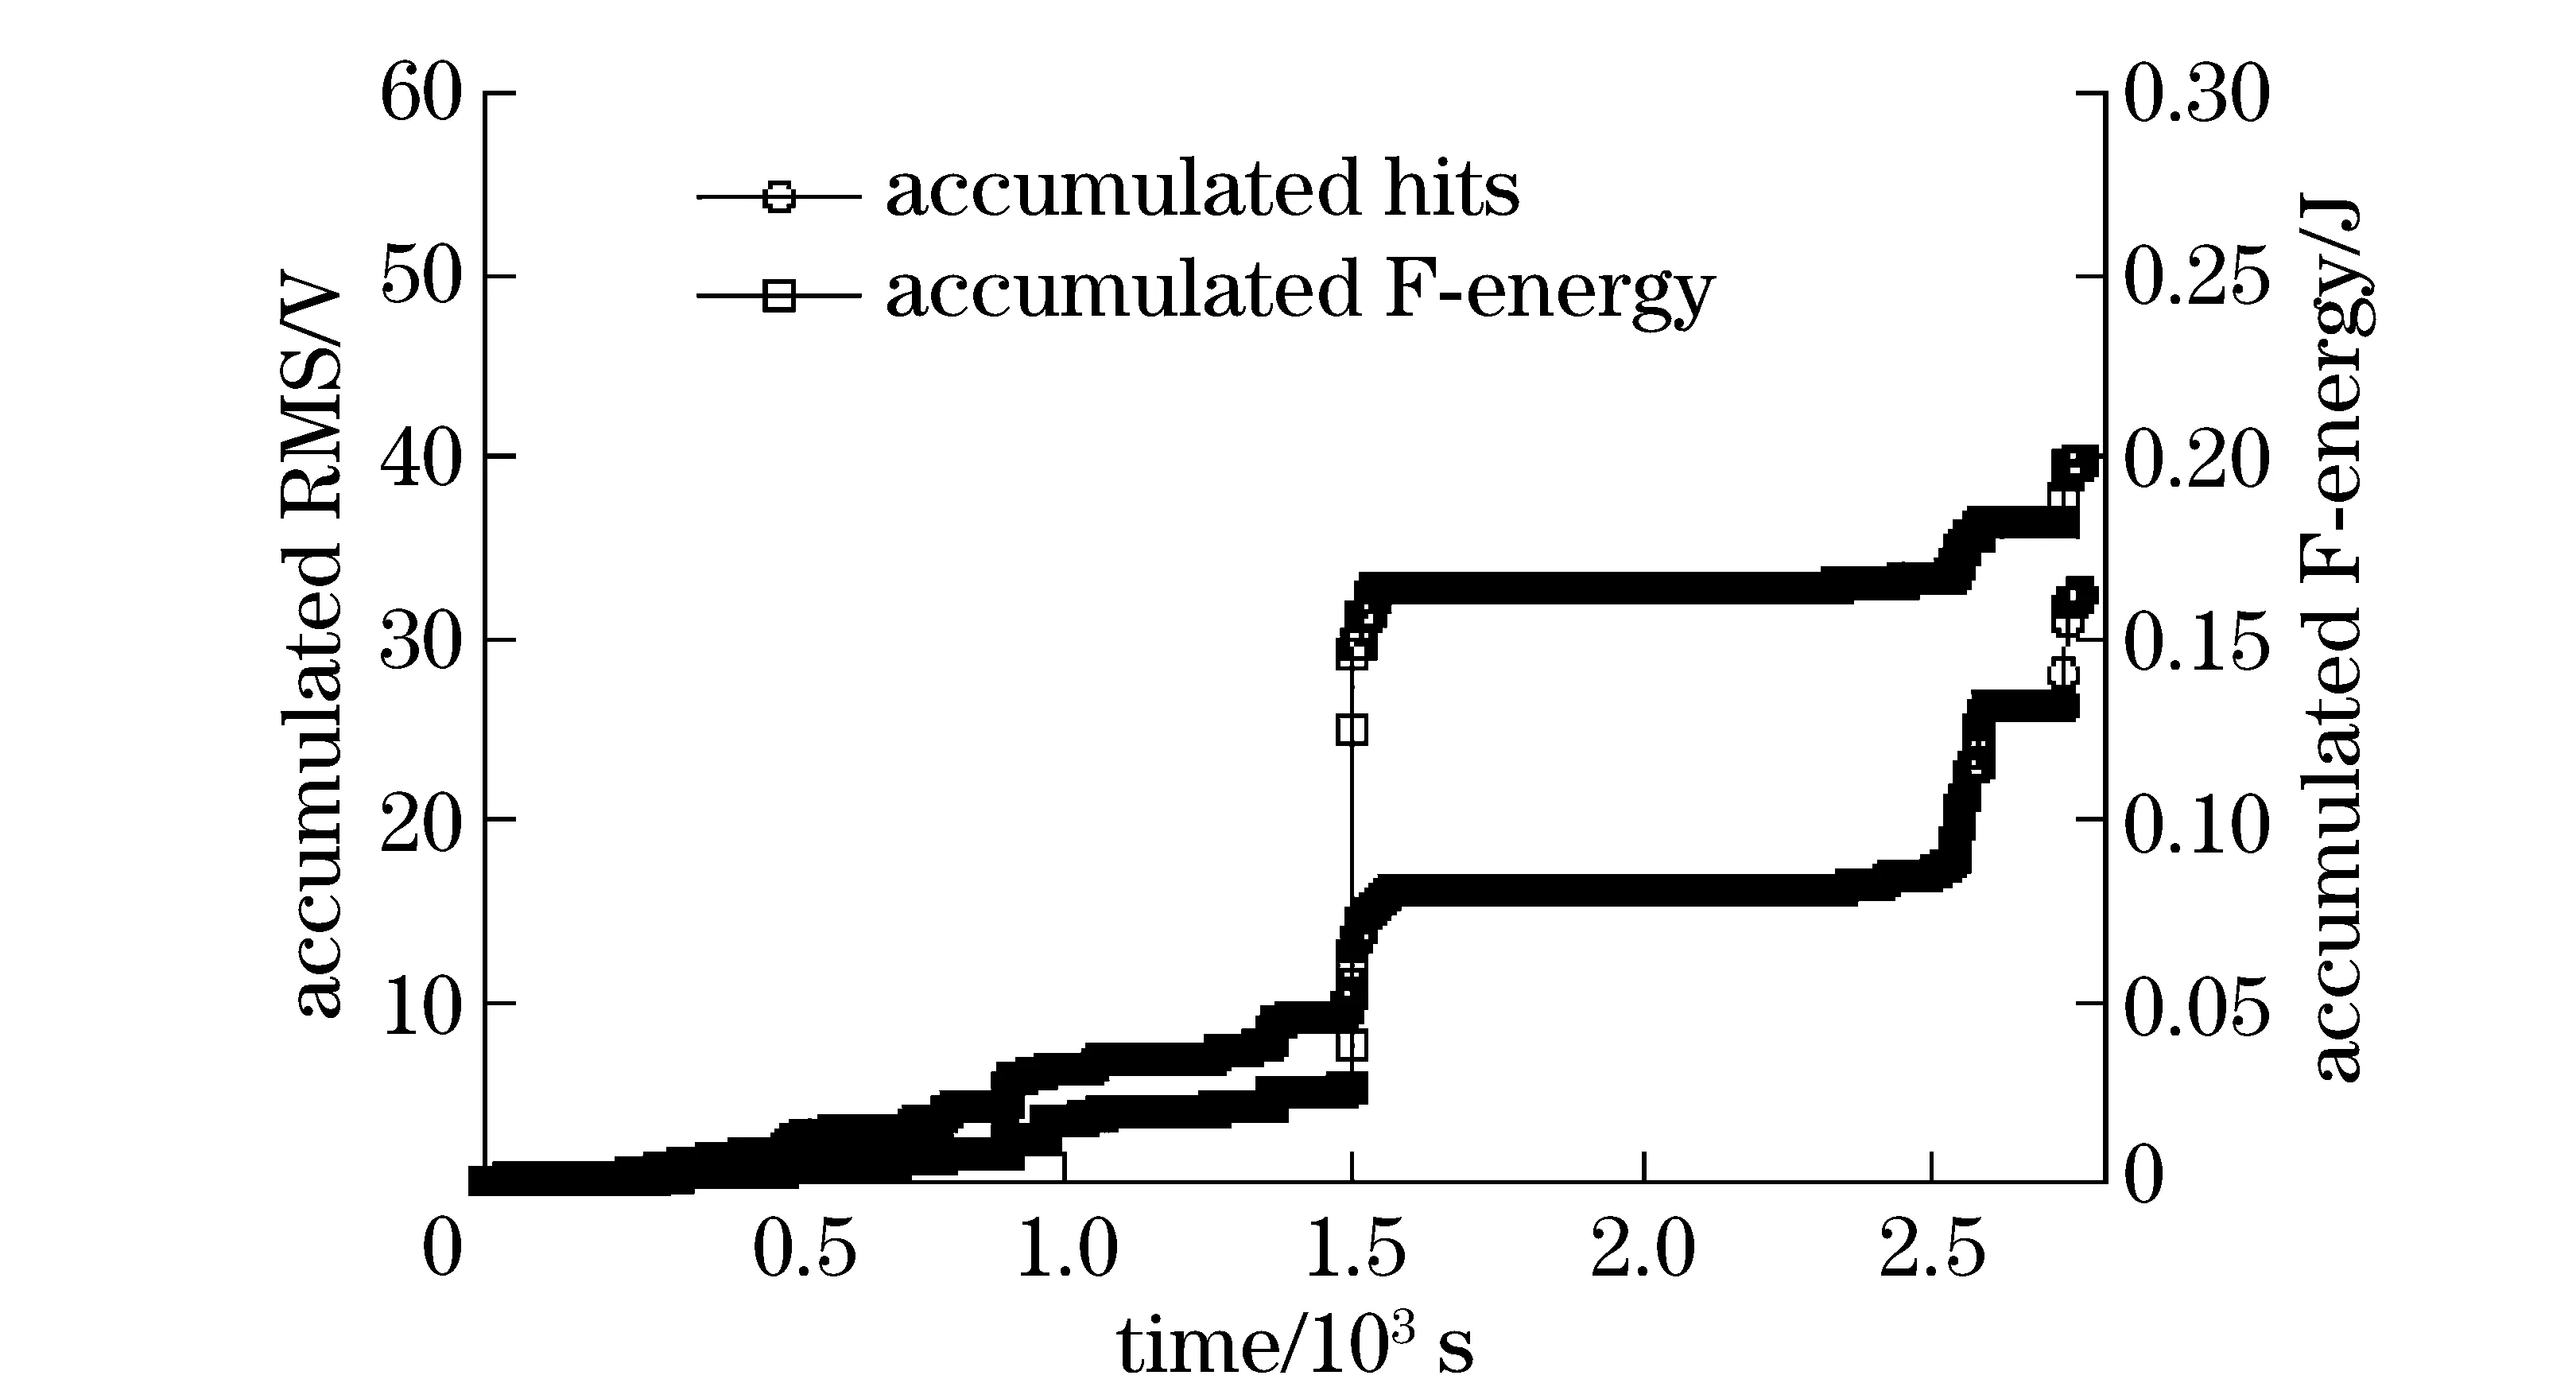
Fig.6 Two parameters of AE signals for gear B
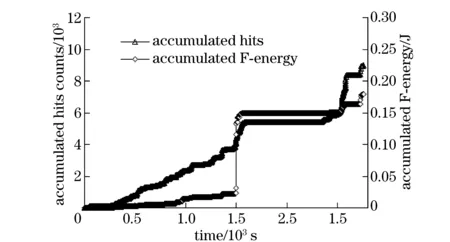
Fig.7 Another two parameters of AE signals for gear B
In the next section, the correlations and linear regression analysis between the F-energy and another three parameters will be used for further exploring.
3.3 Correlation coefficient analysis
The linear regression and correlation analysis are performed to determine the degree of linear association between two different variables. We actually call itrhere, andris calculated by the Pearson method. Generally, two variables have significant correlation ifr>0.95, high correlation if 0.95>r>0.8, moderate correlation if 0.8>r>0.5, and low correlation or uncorrelated ifr<0.5.
Tab.2 shows the correlation coefficient,r, among the accumulated F-energy, RMS, relative energy, and hits of seven AE datasets from all testing gears. From Tab.2, almost all thervalues are greater than 0.8, showing that the F-energy is in good linear correlativity with other three parameters. In particular, correlation coefficient between the F-energy and relative energy is more than 0.99, which indicate significant correlation from the view of energy. Because of threshold and low noise level of experimental environment, the values between the F-energy and relative energy are approximate, as illustrated in Fig.4, Fig.5, Fig.6, and Fig.7.
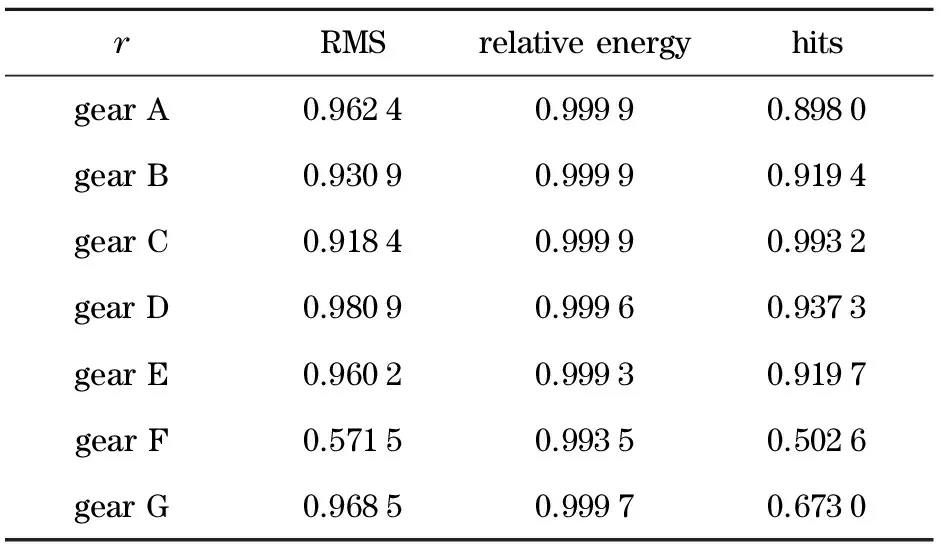
Tab.2 Correlation coefficientramong AE
4 Conclusions
This paper presented and verified a new fatigue damage evaluation method based on AE signals in frequency domain. The specific frequency range of bending fatigue cracks propagation was acquired through frequency domain analysis and the fruit was validated subsequently. The value of the F-energy was obtained by integrating the power spectrum in this frequency band. The growth trends of the F-energy in comparison to RMS, relative energy and hits together with the correlation analysis demonstrated that the method can describe the fatigue behavior of testing gears effectively. Based on this study, the following conclusions can be drawn:
①There is significant correlation between the accumulated F-energy curve and the accumulated relative energy, hits, RMS curves. Moreover, the time which distinguished the fatigue growth stage from stable propagation to unstable propagation of the four parameters is going to be identical. Therefore, the F-energy can describe fatigue crack extension as well. However, RMS, relative energy and hits are restricted subjectively by setting threshold, and relative energy will include some noises inevitably. Consequently, the F-energy is found to be more suitable to the fatigue state monitoring of metal components.
②Previous researchers usually performed experiments using standard specimens with pre-crack. Very few of them conducted fatigue test using actual parts. The method may be effective for field conditions to monitor fatigue damage and evaluate remaining life for in-service parts.
③Usually, the fatigue crack growth of actual parts in-service is extremely complicated. Tiny cracks may appear inside or on the surface of parts and they could not be measured validly. This problem will be paid significant attention in the future.
[1] Eaton M J, Pullin R, Hensman J J, et al. Principal component analysis of acoustic emission signals from landing gear components: an aid to fatigue fracture detection [J]. Strain, 2011, 47:588-594.
[2] McBride S L, Hong Y, Pollard M. Enhanced fatigue crack detection in ageing aircraft using continuous acoustic emission [J]. Review Progress Quanty Nondestructive Evaluation, 1993, 12:2191-2197.
[3] Gong Z, Nyborg E O, Oommen G. Acoustic emission monitoring of steel railroad bridges [J]. Materials Evaluation, 1992,50(7):883-887.
[4] Yu J G, Ziehl P, Zarate B, et al. Prediction of fatigue crack growth in steel in bridge components using acoustic emission [J]. Journal of Constructional Steel Research, 2011,67(8):1254-1260.
[5] Fowler T J. Chemical industry application of acoustic emission [J]. Materials Evaluation, 1992,50:875-882.
[6] Milos J, Robert K, Patrik D, et al. Mechanisms of plastic deformation in AZ31 magnesium alloy investigated by acoustic emission and transmission electron microscopy [J]. Materials Science Engineering A, 2007,462(1-2):311-315.
[7] Han Z Y, Luo H Y, Wang H W. Acoustic emission during fatigue crack propagation in a micro-alloyed steel and welds [J]. Materials Science Engineering A, 2001,528(25-26):4372-4380.
[8] Chang H, Han E H, Wang J Q, et al. Acoustic emission study of fatigue crack closure of physical short and long cracks for aluminum alloy LY12CZ [J]. International Journal of Fatigue, 2009,31(3):403-407.
[9] Pullin R, Eaton M J, Hensman J J, et al. Validation of acoustic emission (AE) crack detection in aerospace grade steel using digital image correlation [J]. Applied Mechanics and Materials, 2010, 24-25:221-226.
[10] Kohn D H, Ducheyne P, Awerbuch J. Acoustic emission during fatigue of TI-6AL-4V incipient fatigue crack detection limits and generalized data analysis methodology [J]. Journal of Materials Science, 1992,27(12):3133-3142.
[11] Refahi O A, Zucchelli A, Ahmadi M, et al. An integrated approach based on acoustic emission and mechanical information to evaluate the delamination fracture toughness at mode I in composite laminate [J]. Materials and Design, 2011, 32(3):1444-1455.
[12] Bassim M N, Lawrence S S, Liu C D. Detection of the onset of fatigue crack growth in rail steels using acoustic emission [J]. Engineering Fracture Mechanics, 1994,47(2):207-214.
[13] Berkovits A, Fang D. Study of fatigue crack characteristics by acoustic emission [J]. Engineering Fracture Mechanics, 1995,51(3):401-416.
[14] Oh K H, Jung C K, Yang Y C, et al. Acoustic emission behavior during fatigue crack propagation in 304 stainless steel [J]. Key Engineering Materials, 2004, 261-263:1325-1330.
[15] Chen H L, Choi J H. Acoustic emission study of fatigue cracks in materials used for AVLB [J]. Journal of Nondestructive Evaluation, 2004,23(4):133-151.
[16] Kanji O. Fundamentals of acoustic emission [M]. Los Angeles: University of California Press, 1979.
[17] Roberts T M, Talebzadeh M. Acoustic emission monitoring of fatigue crack Propagation [J]. Journal of Constructional Steel Research, 2003,59(6):695-712.
(Edited by Cai Jianying)
2013- 01- 31
Supported by the National Natural Science Foundation of China (50975030)
TH 17 Document code: A Article ID: 1004- 0579(2014)02- 0190- 06
E-mail: bit_huangjie@bit.edu.cn
 Journal of Beijing Institute of Technology2014年2期
- Journal of Beijing Institute of Technology的其它文章
- Expert ranking method based on ListNet with multiple features
- Contour tracking using weighted structure tensor based variational level set
- Consensus problem of multi-agent systems under arbitrary topology
- One-piece coal mine mobile refuge chamber with safety structure and less sealing risk based on FEA
- Three-dimension micro magnetic detector based on GMI effect
- On measured-error pretreatment of bionic polarization navigation
