Oxygen transfer characteristics of water and bubble mixture pipe flow through two sudden contractions and expansions*
YIN Ze-gao (尹則高)
Shandong Province Key Laboratory of Ocean Engineering, Ocean University of China, Qingdao 266100, China, E-mail: yinzegao@ouc.edu.cn
XIE Shao-hua (解紹華)
Engineering College, Ocean University of China, Qingdao 266100, China
CHENG Dong-sheng (程東升)
Water Environment Department, China Institute of Water Resources and Hydropower Research, Beijing 100038, China
LONG Xiang-yu (龍翔宇)
Engineering College, Ocean University of China, Qingdao 266100, China
(Received June 3, 2013, Revised August 27, 2013)
The dissolved oxygen (DO) concentration is an important index of water quality. This paper studies the dissolved oxygen recovery of the water and bubble mixture pipe flow through two sudden contractions and expansions. A 3-D computational fluid dynamics model is established to simulate the water and bubble mixture flow with a DO transport model. An experiment is conducted to validate the mathematical model. The mathematical model is used to evaluate the effect of geometric parameters on the head loss coefficient, the relative saturation coefficient and the oxygen absorption efficiency. It is found that the contraction ratio is a significant influencing factor, other than the relative length and the relative distance. Given the same relative length and relative distance, the head loss coefficient, the relative saturation coefficient and the oxygen absorption efficiency increase with the decrease of the contraction ratio, respectively. Given the same relative length and contraction ratio, the head loss coefficient increases with the increase of the relative distance firstly, and then decreases gradually, in contrast, the relative saturation coefficient and the oxygen absorption efficiency decrease with the increase of the relative distance firstly, and then increase gradually, the relative saturation coefficient and the oxygen absorption efficiency are inversely proportional to the head loss coefficient, respectively.
dissolved oxygen, two sudden contractions and expansions, head loss coefficient, relative saturation coefficient, oxygen absorption efficiency
Introduction
The dissolved oxygen concentration is an important index of water quality. Generally, the dissolved oxygen in a water body originates from the atmosphere and the photosynthesis of water-inhabiting plants. Sudden contraction and expansion (SCE) pressurized flow is a useful method to release the water from the reservoir, and it was utilized for Mica dam, Canada, due to its simplicity, the convenient construction and the high dissipation ratio[1]. In order to have a desired flow rate, the released water often comes from the reservoir bottom, where the DO concentration is low due to the decomposition of organic matter by bacteria and the lack of oxygen absorption from atmosphere[2]. When the water of low DO concentration is released into the downstream river, it will result in the negative effect on the aquatic organisms, such as fish[3]. The air injection has economical and operational advantages to increase the DO concentration in such a water body, to meet the relevant DO standards[4,5].
This paper studies the effective and environmentally-friendly operation of the two SCE pressurized flow. In this study, a commercial 3-D computational fluid dynamics model is employed to study the water and bubbles pressurized flow through the two SCE, coupled with a dissolved oxygen transport model. An experiment is conducted to measure the velocity and the DO change to validate the mathematical model. The validated model is then used to study the geometric factors influencing the head loss coefficient, the relative saturation coefficient and the oxygen absorption efficiency.
1. Mathematical model

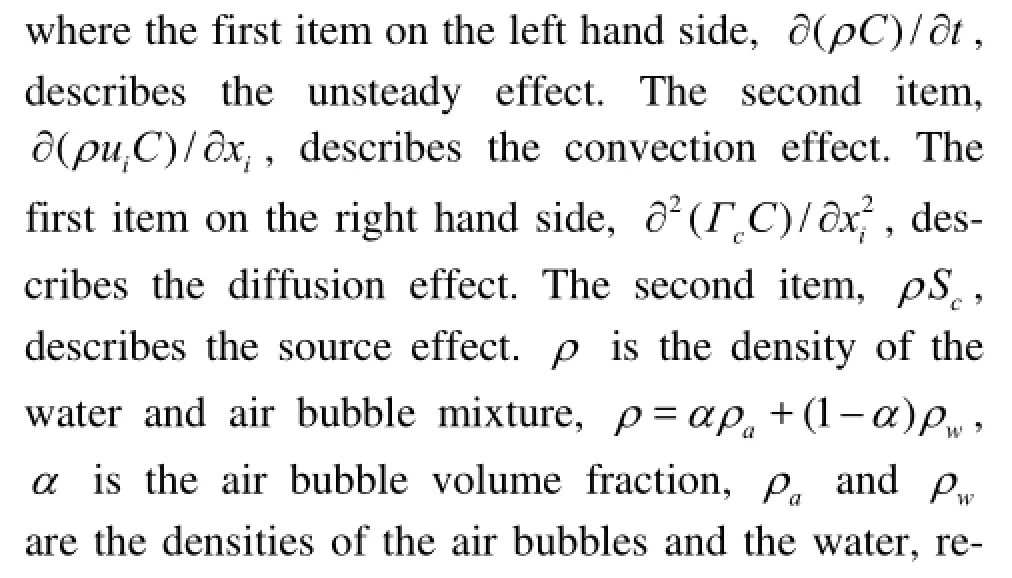


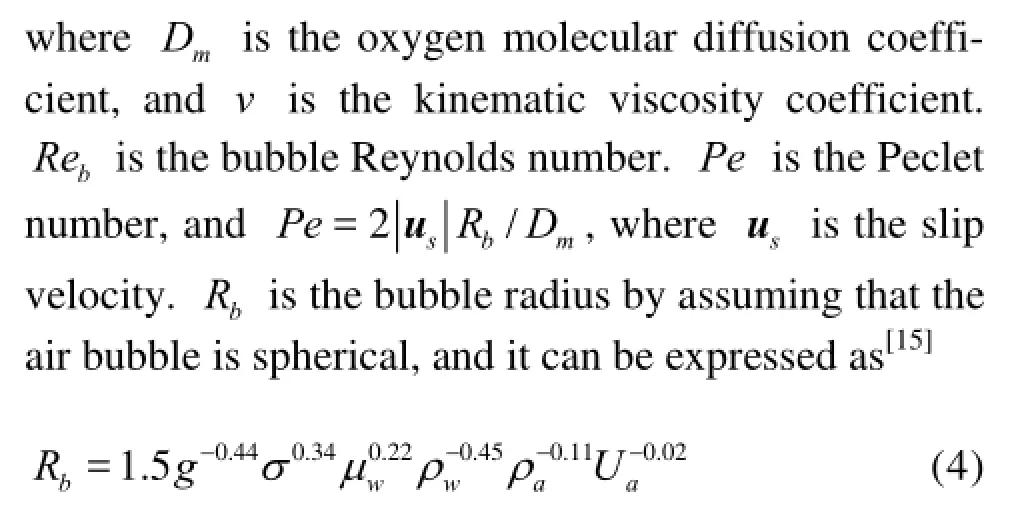
where g is the gravitational acceleration, σ is the surface tension, μwis the dynamic viscosity of the water, and Uais the superficial air velocity. aBis the specific interfacial area of the bubbles, and aB=3α/ Rb. Csis the saturation DO concentration.


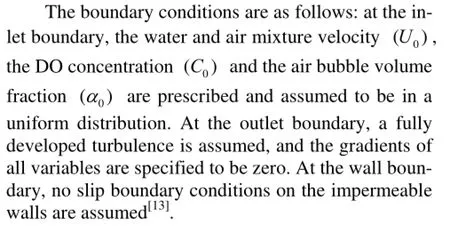

Fig.1 Experimental sketch
2. Mathematical model validation by experimental data
2.1Experimental setup and procedure
In order to validate the proposed model, an experiment is conducted in the Hydraulic Lab at Ocean University of China. An acrylic circular horizontal pipe with a radius (R) of 0.065 m and a length of 9.8 m connects with two water tanks. Two SCE sections are fixed at 5 m downstream of the pipe inlet, and both sections have the same geometric parameters to simplify the study. In details, the contraction ratio (r/ R) is 0.6, the relative length (L/ R) is 8, and the relative distance between two SCE sections (L'/R) is 10, where r is the radius of the section, L is the length of the section, L' is the distance between two sections. The aeration hole lies at 1.5 m downstream of the pipe inlet, and its diameter is 0.01 m, as shown in Fig.1.
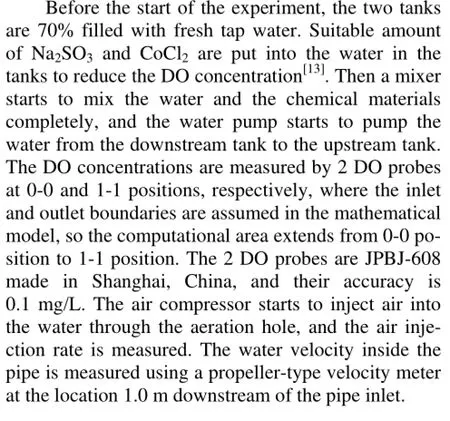
2.2Experimental results and comparison with mathematical model
The velocity is measured as U0=0.211m/s , the water temperature is measured as T=20.4oC, and a0is computed as 4.21% based on the data of the air flow meter. The initial DO concentration of all the water body is measured as 0.23 mg/L. After the start of the experiment, the DO concentrations at sections 0-0 (C0) and 1-1 (C1) are measured and recorded every120 s, from 0 s to 600 s. C0and C1change with time and are shown in Fig.2. Here the horizontal coordinate is the time. Figure 2 shows the measured C0increasing from 0.23 mg/L to 0.28 mg/L in 600 s, and the measured C1is increased from 0.23 mg/L to 0.37 mg/L.
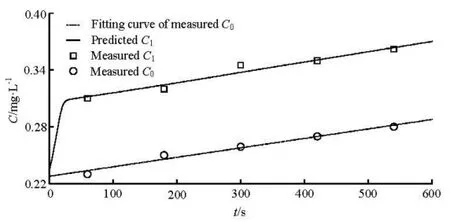
Fig.2 Predicted DO concentrations and experimental results
The geometries of the study domain are dealt with the GAMBIT program and are divided into hexahedral/hybrid elements. The mesh size is 0.0008 m. To consider the boundary effects, the meshes near the inlet, the outlet, and the wall boundary are refined. The grid convergence index method is employed to ascertain the independence of the computational results on the meshes[16]. The aforementioned experimental condition and the corresponding parameters including the property coefficients of the water and the bubbles are adopted in the simulations by using Eqs.(1), (2), (3) and (4). A linear fitting curve of the measured0C is regressed to express the variation of the DO concentration and applied in the mathematical model as the inlet boundary. Figure 2 also shows that with time, the predicted1C increases fast at the start and slowly after 30 seconds. The average value of the predicted 1C is 0.339 mg/L, and its standard deviation is 0.024. The predicted1C agrees with the measured data of the experiment at section 1-1 approximately. Figure 2 shows that it is valid and reliable to compute the DO concentration with the proposed model.
3. Computational results and analyses
64 flow cases are simulated: U0=5 m/s , a0= 0.02, C0=2 mg/L , D=13.7 m and T=20oC, with r/ R increasing from 0.5 to 0.8 with a step size of 0.1, L/ R increasing from 4 to 10 with a step size of 2, and L'/R increasing from 4 to 10 with a step size of 2.
3.1Head loss coefficient
The head loss coefficient is a significant index to evaluate the energy dissipation. For a horizontal pipe flow, the head loss coefficient, ξ, can be expressed as follows[1]

where p0and p1are the average pressures at sections 0-0 and 1-1, respectively.

Fig.3 Head loss coefficient and relative distance


3.2Relative saturation coefficient


where Δt is the flow travel time from section 0-0 to section 1-1.
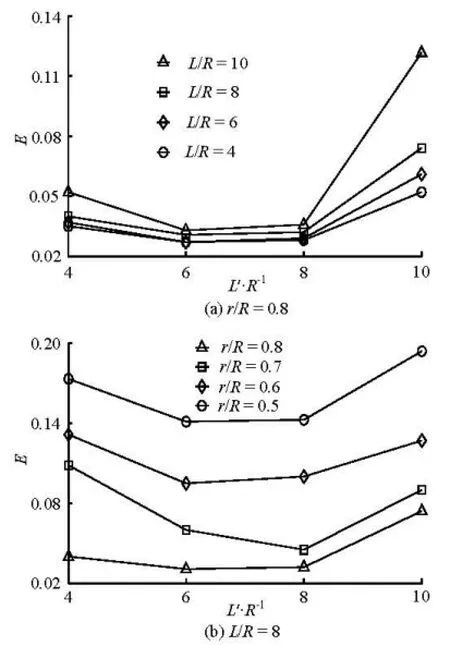
Fig.4 Relative saturation coefficient and relative distance


3.3Oxygen absorption efficiency
In order to investigate the oxygen absorption from the injected air, the oxygen absorption efficiency, F, is introduced as follows[13]

where Cais the oxygen concentration of the injected air, Ca=310 mg/L when T=20oC and under 1 atm pressure.
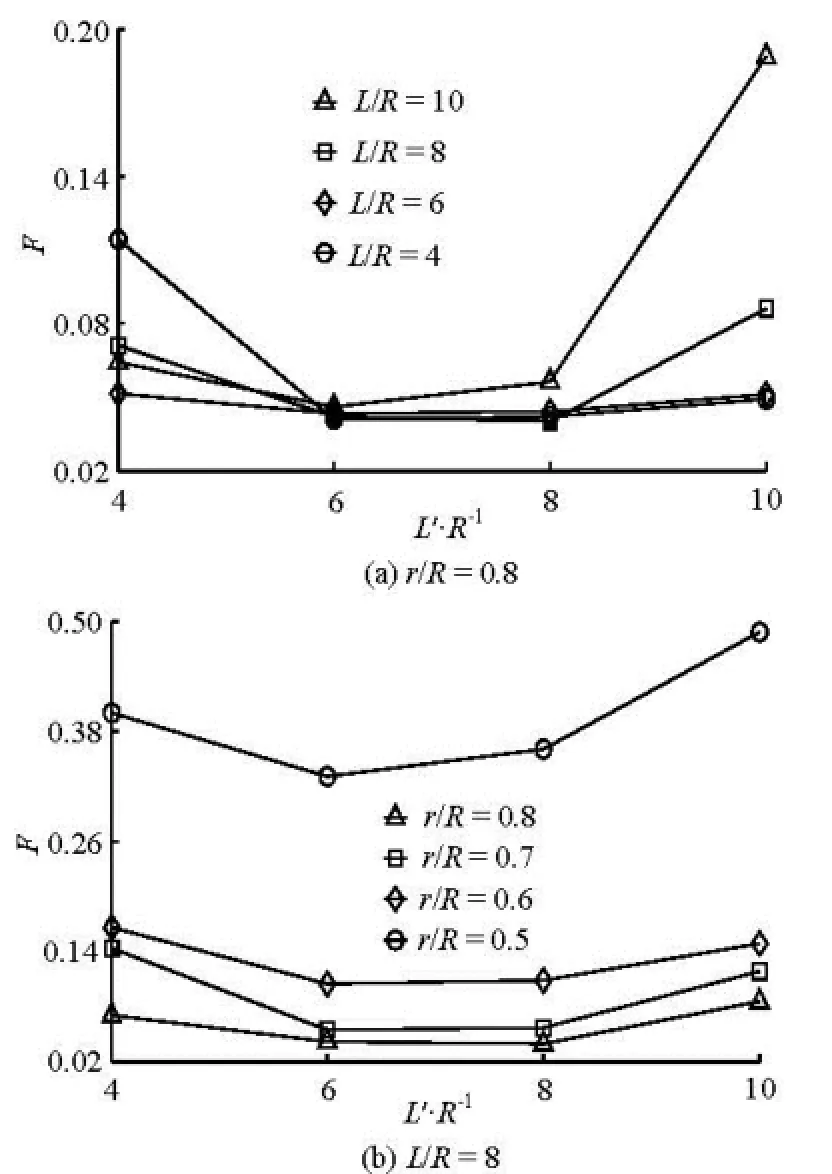
Fig.5 Oxygen absorption efficiency and the relative distance
Figure 5(a) shows the relationship between F and L'/R with r/ R=0.8. F decreases with the increase of L'/R firstly, reaches the minimum value at L'/R=7, and then increases gradually. Figure 4(a)and Fig.5(a) show that F distribution is similar to that of E. Figure 5(b) shows the relationship between F and L'/R with L/ R=8, F increases with the decrease of r/ R, and r/ R influences F much more than L'/R does.
4. Conclusions
With ANSYS FLUENT 12.0 software, the 3-D RNG k-ε mathematical model is employed to simulate the water and bubbles mixture pipe flow through two SCE, and a dissolved oxygen transport model is employed to simulate the DO concentration under unsaturated conditions. An experiment is conducted to measure the DO concentration. The computational results are compared with the experimental results. The mathematical model is employed to evaluate the effect of geometric parameters on ξ, E and F. It is found that r/ R is a significant factor to ξ, E and F, other than L'/R and L/ R. Given the same L/ R and L'/R, ξ, E and F increase with the decrease of r/ R, respectively. Given the same L/ R and r/ R, ξ increases with the increase of L'/R firstly, and then decreases gradually. In contrast, E and F decrease with the increase of L'/R first, and then decrease gradually, E and F are inversely proportional to ξ, respectively.
Generally speaking, two SCE pipe flow behaves much more complex than those in the mathematical model. For example, if the bubble breakup and coalescence occurs, the bubbles will bring a lot of oxygen into the water and changes the DO concentration of the water body significantly, resulting in more complicated oxygen transfer characteristics. In future work, the bubble’s interaction should be taken into account to model the practical condition more accurately.
[1] WU J., AI W. and ZHOU Q. Head loss coefficient of orifice plate energy dissipater[J]. Journal of Hydraulic Research, 2010, 48(4): 526-530.
[2] ISHIKAWA T., SUZUKI T. and QIAN X. Hydraulic study of the onset of hypoxia in the tone river estuary[J]. Journal of Environmental Engineering, 2004, 130(5): 551-561.
[3] O’BOYLE S., MCDERMOTT G. and WILKES R. Dissolved oxygen levels in estuarine and coastal waters around Ireland[J]. Marine Pollution Bulletin, 2009, 58(11): 1657-1663.
[4] ALP E., MELCHING C. S. Allocation of supplementary aeration stations in the chicago waterway system for dissolved oxygen improvement[J]. Journal of Environmental Management, 2011, 92(6): 1577-1583.
[5] LIMA NETO I. E., ZHU D. Z. and RAJARATNAM N. et al. Dissolved oxygen downstream of an effluent outfall in an ice-covered river: Natural and artificial aeration[J]. Journal of Environmental Engineering, 2007, 133(11): 1051-1060.
[6] CHEN I. Y., WONGWISES S. and YANG B. C. et al. Two-phase flow across small sudden expansions and contractions[J]. Heat Transfer Engineering, 2010, 31(4): 298-309.
[7] ROUL M. K., DASH S. K. Two-phase pressure drop caused by sudden flow area contraction/expansion in small circular pipes[J]. International Journal for Numerical Methods in Fluids, 2011, 66(11): 1420-1446.
[8] URBAN A. L., GULLIVER J. S. and JOHNSON D. W. Modeling total dissolved gas concentration downstream of spillways[J]. Journal of Hydraulic Engineering, ASCE, 2008, 134(5): 550-561.
[9] POLITANO M., ARENAS AMADO A. and BICKFORD S. et al. Investigation into the total dissolved gas dynamics of wells dam using a two-phase flow model[J]. Journal of Hydraulic Engineering, ASCE, 2011, 137(10): 1257-1268.
[10] BUSCAGLIA G. C., BOMBARDELLI F. A. and GARCIA M. H. Numerical modeling of large-scale bubble plumes accounting for mass transfer effects[J]. International Journal of Multiphase Flow, 2002, 28(11): 1763-1785.
[11] UNSAL M., BAYLAR A. and TUGAL M. et al. Increased aeration efficiency of high-head conduit flow systems[J]. Journal of Hydraulic Research, 2008, 46(5): 711-714.
[12] BAYLAR A., AYDIN M. C. and UNSAL M. et al. Numerical modeling of venturi flows for determining air injection rates using FLUENT V6.2[J]. Mathematical and Computational Applications, 2009, 14(2): 97-108.
[13] YIN Z., ZHU D. Z. and CHENG D. et al. Oxygen transfer by air injection in horizontal pipe flow[J]. Journal of Environmental Engineering, 2013, 139(6): 908-912.
[14] ANSYS INC. ANSYS FLUENT user’s guide[M]. Release 12.0, Canonsburg, PA, 2009.
[15] WILKINSON P. M., HARINGA H. and Van DIERENDONCK L. L. Mass transfer and bubble size in a bubble column under pressure[J]. Chemical Engineering Science, 1994, 49(9): 1417-1427.
[16] ROACHE P. J. Perspective: A method for uniform reporting of grid refinement studies[J]. Journal of Fluids Engineering, 1994, 116(3): 405-413.
[17] TIAN Zhong, XU Wei-lin and WANG Wei et al. Hydraulic characteristics of plug energy dissipater in flood discharge tunnel[J]. Journal of Hydrodynamics, 2009, 21(6): 799-806.
[18] YIN Ze-gao, ZHAO Qiang and CAO Xian-wei. Oxygen transport and diffusion numerical simulation on water and air mixture of plug discharge[J]. Advances in Water Science, 2013, 24(3): 410-417(in Chinese).
10.1016/S1001-6058(14)60083-4
* Project supported by the National Natural Science Foundation of China (Grant No. 51009123), the Qingdao Science and Technology Development Plan (Grant No. 11-2-4-1-(7)-jch).
Biography: YIN Ze-gao (1977-), Male, Ph. D.,
Associate Professor
- 水動力學研究與進展 B輯的其它文章
- Retard function and ship motions with forward speed in time-domain*
- An iterative Rankine boundary element method for wave diffraction of a ship with forward speed*
- Sediment rarefaction resuspension and contaminant release under tidal currents*
- Stability of fluid flow in a Brinkman porous medium-A numerical study*
- Vadose-zone moisture dynamics under radiation boundary conditions during a drying process*
- Experimental and numerical study on hydrodynamics of riparian vegetation*

