
Study on transport of powdered activated carbon using a rotating circular flume*
2013-06-01 12:29:58YINHailong尹海龍QIUMinyan邱敏燕
水動(dòng)力學(xué)研究與進(jìn)展 B輯 2013年5期
關(guān)鍵詞:海龍
YIN Hai-long (尹海龍), QIU Min-yan (邱敏燕)
Key Laboratory of Yangtze River Water Environment, Ministry of Education, Shanghai 200092, Tongji University, China, E-mail: yinhailong@#edu.cn
XU Zu-xin (徐祖信)
State Key Laboratory of Pollution Control and Resource Reuse, Tongji University, Shanghai 200092, China
(Received May 14, 2013, Revised June 18, 2013)
Study on transport of powdered activated carbon using a rotating circular flume*
YIN Hai-long (尹海龍), QIU Min-yan (邱敏燕)
Key Laboratory of Yangtze River Water Environment, Ministry of Education, Shanghai 200092, Tongji University, China, E-mail: yinhailong@#edu.cn
XU Zu-xin (徐祖信)
State Key Laboratory of Pollution Control and Resource Reuse, Tongji University, Shanghai 200092, China
(Received May 14, 2013, Revised June 18, 2013)
This study employed a rotating flume to examine the Powdered Activated Carbon (PAC) transport with water flow. The initial PAC concentration was 10 mg/L-30 mg/L, and PAC concentration versus time under a specified cross-sectional averaging fluid shear was observed. Results show that compared with PAC deposition in still water, PAC is depleted to zero faster under a fluid shear of 0.02 Pa, due to PAC agglomeration with the fluid shear. However, since PAC floc size only ranges from a single particle (2 μm) to approximate 6 μm, an increasing of instantaneous turbulent fluctuations could counteract the force of PAC floc settling downward, and as a result the steady PAC concentration increases with the increase of shear stress. It is found that the critical shear stress for PAC deposition is about 0.60 Pa, and further the PAC deposition probability is presented according to the experimental scenarios between 0.02 Pa and 0.60 Pa. Combining the PAC transport and deposition formula with PAC-pollutant removal model provides an insight into PAC deployment in raw water aqueduct for sudden open water source pollution.
cohesive sediment, Powdered Activated Carbon (PAC), transport, deposition
Introduction
Powdered Activated Carbon (PAC) has proved to be a widely used and accepted method for the removal of water pollutants under emergency in water supplies by using the water aqueduct itself as a part of the treatment process as water is transported from water sources to drinking water plant. The prolonged contact of PAC with raw water in the aqueduct with the magnitude of kilometers may improve PAC adsorption efficiency. In 2008 and 2009, the dedicated facilities for emergency PAC additions were built in Beijing and in Shanghai. The Beijing facilities are located in the stations for the Yangtze River South-to-North Diversion Project and the Shanghai ones are used in a project on the Huangpu River.
For the effective operation of PAC feeding facilities, it is necessary to understand the transport processes of PAC in the water aqueduct. These interactive processes are comprised of PAC transport by advection, turbulent diffusions, and sediment deposition.
Generally, PAC can be characterized as fine sediments with cohesive character. Up to know, there have been extensive literatures on the characteristics and transport of fine sediments since 1980s. For example, Lick[1]have studied the transport mechanism of cohesive fine sediments in the Great Lakes region for more than 20 years, involving the general properties of sediments, sediments erosion, sediments flocculation, settling, deposition and consolidation as a whole system.. Flocculation characteristics and main factors influencing aggregation for cohesive fine sediments were also reviewed by Yang et al. in China[2]. Specifically, the investigators have invoked the concept of fractal theory, by which still settling speed is proportional to a solid particle diameter as a power of fractal dimension[1,3-6]. The applicability of this theory was supported by the measurements of different size settling velocities of suspended particles in a tidal water[7-9]. Another focus is the critical criterion fordistinguishing floc sedimentation and shear stress, including the distribution of floc size[10,11], the effect of shear on the floc size[12-15], and the cohesive sediments flocculation, transport with fluid shear using experimental flumes like rotating circular flumes, zig-zag straight flumes[16,17]. Finally, these studies were combined with mathematical models to predict the transport and fate of cohesive sediments[18,19].
However, to date, no study has been published in the peer-reviewed literature with respect to PAC transport characteristics. In addition, the process of sediments deposition and transport is still left to be discussed. The purpose of this study is to investigate the transport of PAC using a rotating circular flume. The results from this study may be further used in providing insight into PAC deployment in raw water aqueduct for sudden pollution of open water sources.
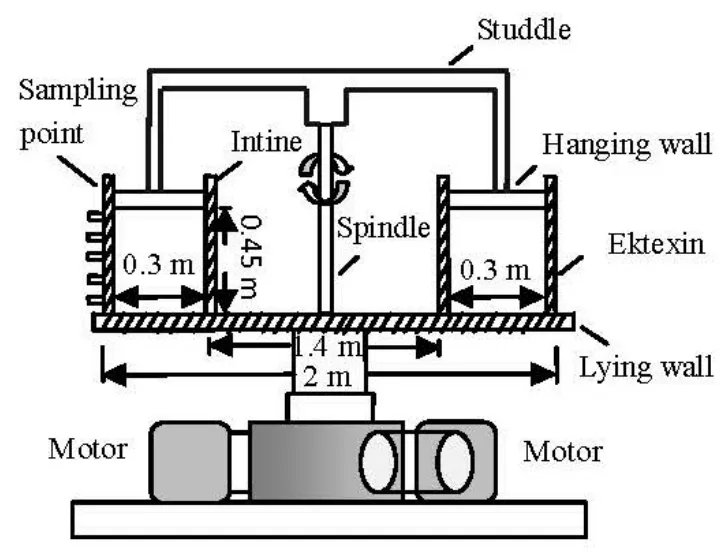
Fig.1 Schematic of experimental set-up
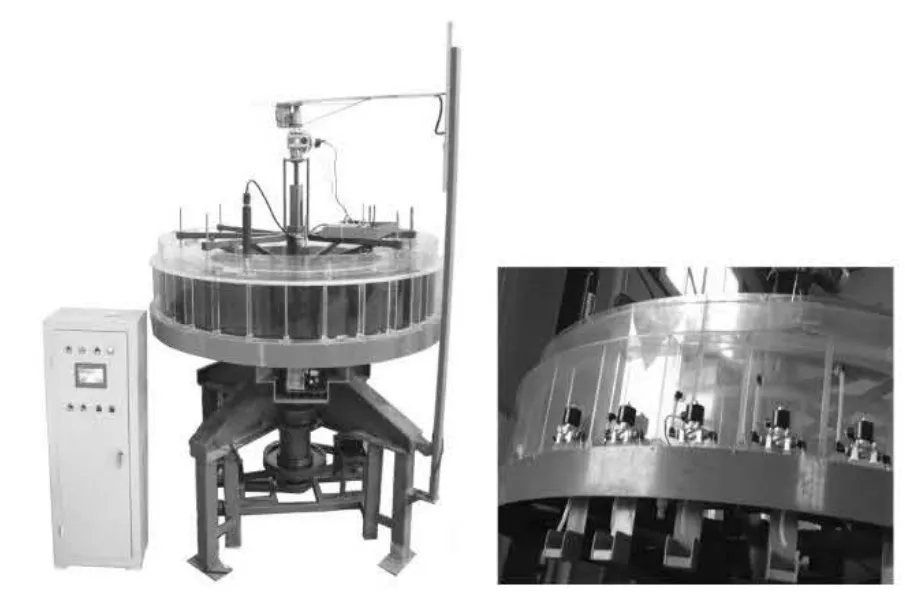
Fig.2 Rotating circular flume and sampling device
1. Experimental setup
A re-circulating flume has been proved to be a more effective experimental device to quantify sediment deposition because it is capable of achieving a sufficient HRT to simulate the whole deposition process. In order to achieve this, a rotating circular flume was constructed at Tongji University, Shanghai, China (see Figs.1-2). The flume was designed as 2.0 m in mean diameter, 0.30 m in width and 0.45 m in depth. A counter rotating top cover (ring) was fitted inside the flume with close tolerance, and made contact with the water surface in the flume, so as to reduce secondary circulation.
Before the experiment, a kind of plastic particles was employed to indicate if there is lateral secondary circulation. When the flume and ring rotated in the opposite direction, the particles moved along the centerline of the flume instead of deflecting from the centerline, it indicated the elimination of secondary circulation, and hereby the ratio between the flume and ring rotation was adjusted. The water flowing velocity in the flume was recorded using an ADV (Sontek 10 MHz) for measuring the real-time instantaneous velocity and Nivus PCM Pro for determining the vertical velocity profile and vertically averaged velocity.
A kind of commercially available PAC was obtained from the Shanghai Drinking Water Treatment Plant. China’s Technical Guideline on City’s Water Supply suggests[20]that usually PAC dose should not be above 20 mg/L-30 mg/L, so the scenarios for PAC dose less than 30 mg/L were employed in this study.
For the deposition process, water was placed in the flume and a known amount of PAC was added into the flume to form a fully mixed concentration. The PAC-water mixture was then thoroughly mixed mechanically, followed by rotating the flume and the top cover at high speed in the opposite directions for about 20 min. The flume speed was then reduced to a lower rate of shear and the speed was maintained for the duration of the experiment until the PAC concentration remained nearly constant.
To understand the deposition process and the effect of flocculation, a vertical series of outlets were opened in the flume (see Fig.2), from which the samplings were taken at a specified time interval, controlled by the automatic valves installed at the outlets. The PAC concentration was measured with the standard methods of filtering, drying and weighing, and the size distribution of PAC was measured using an Ankersmid laser particle size analyzer (made in The Netherlands).
A comparative study in still water was also performed. This study was conducted in a glass cylinder, designed as 0.80 m in diameter and 0.54 m in height. There were three sample outlets (0.20 m, 0.40 m and 0.54 m from the bottom). The vessel volume assured that water reduction due to sampling was insignificant. Before the experiment, PAC was added into the cylinder with designed initial PAC concentration, and thoroughly mixed with water. Water-PAC samples were then collected from the three vertical outlets every 20 min for the next 200 min. The samples were ovendried and weighted to calculate the PAC concentration.
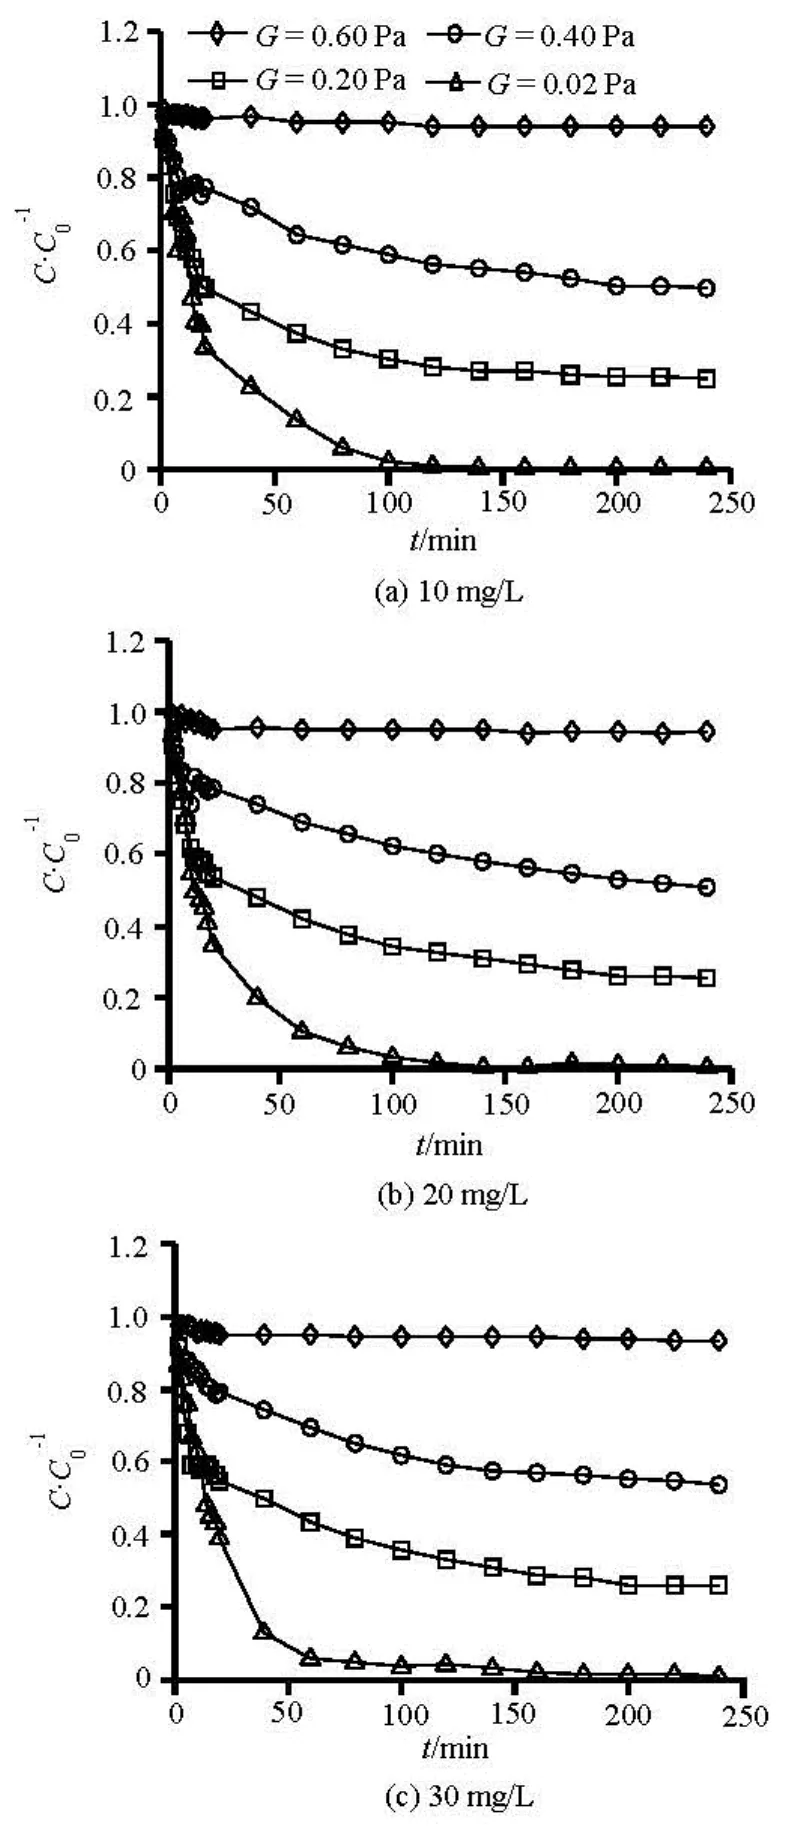
Fig.3 PAC deposition process in the flume as a function of fluid shear and PAC
2. Results and discussion
For the flume deposition process, the resulting PAC concentrations vs. time curves are shown in Fig.3, for initial PAC dose of 10 mg/L, 20 mg/L, 30 mg/L and fluid shear stress as a parameter. The cross-sectional averaging fluid shear was computed with the following equation
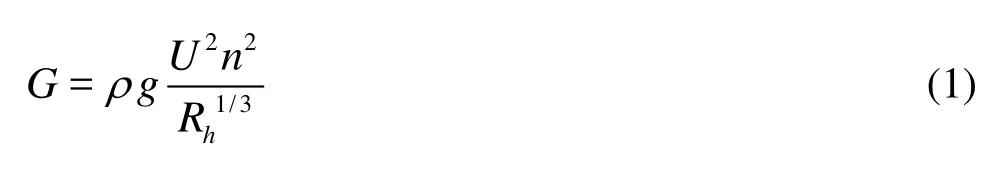
whereGis the cross-sectional averaged fluid shear,ρthe water density,gthe acceleration due to gravity,Rhthe hydraulic radius, which is the ratio of crosssectional area and wetted perimeter,nthe bottom roughness, in this case,n=0.012.
Several significant results and possible explanations for these results are as follows:
(1) For the lower shear stress of 0.02 Pa, all the initial PAC would deposit to the bed after a time of approximately 150 min. A comparative experimental result in still water are shown in Fig.4, demonstrating that the PAC deposition under a shear of 0.02 Pa is much faster than that in still water, due to PAC flocculation.
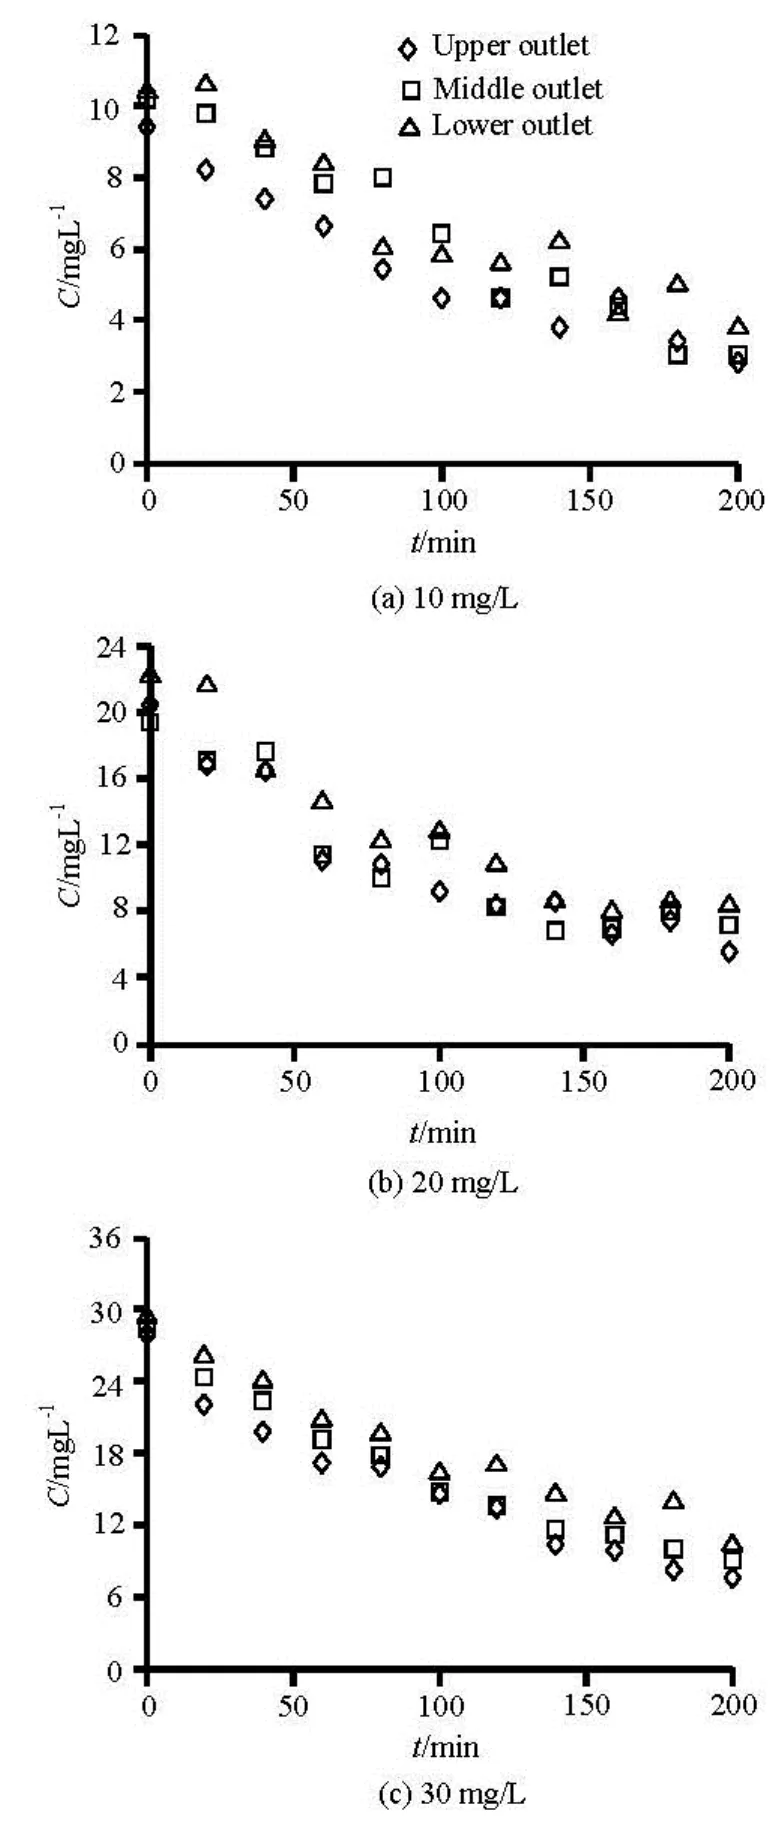
Fig.4 PAC settling process in still water for PAC
(2) For PAC flocculation, the measured PAC floc median size as a function of time is shown in Fig.5, indicating a steady median floc size up to 3 μm-6 μm from the initial value of approximate 1.5 μm, as a function of the product of initial PAC dose and fluidshear.
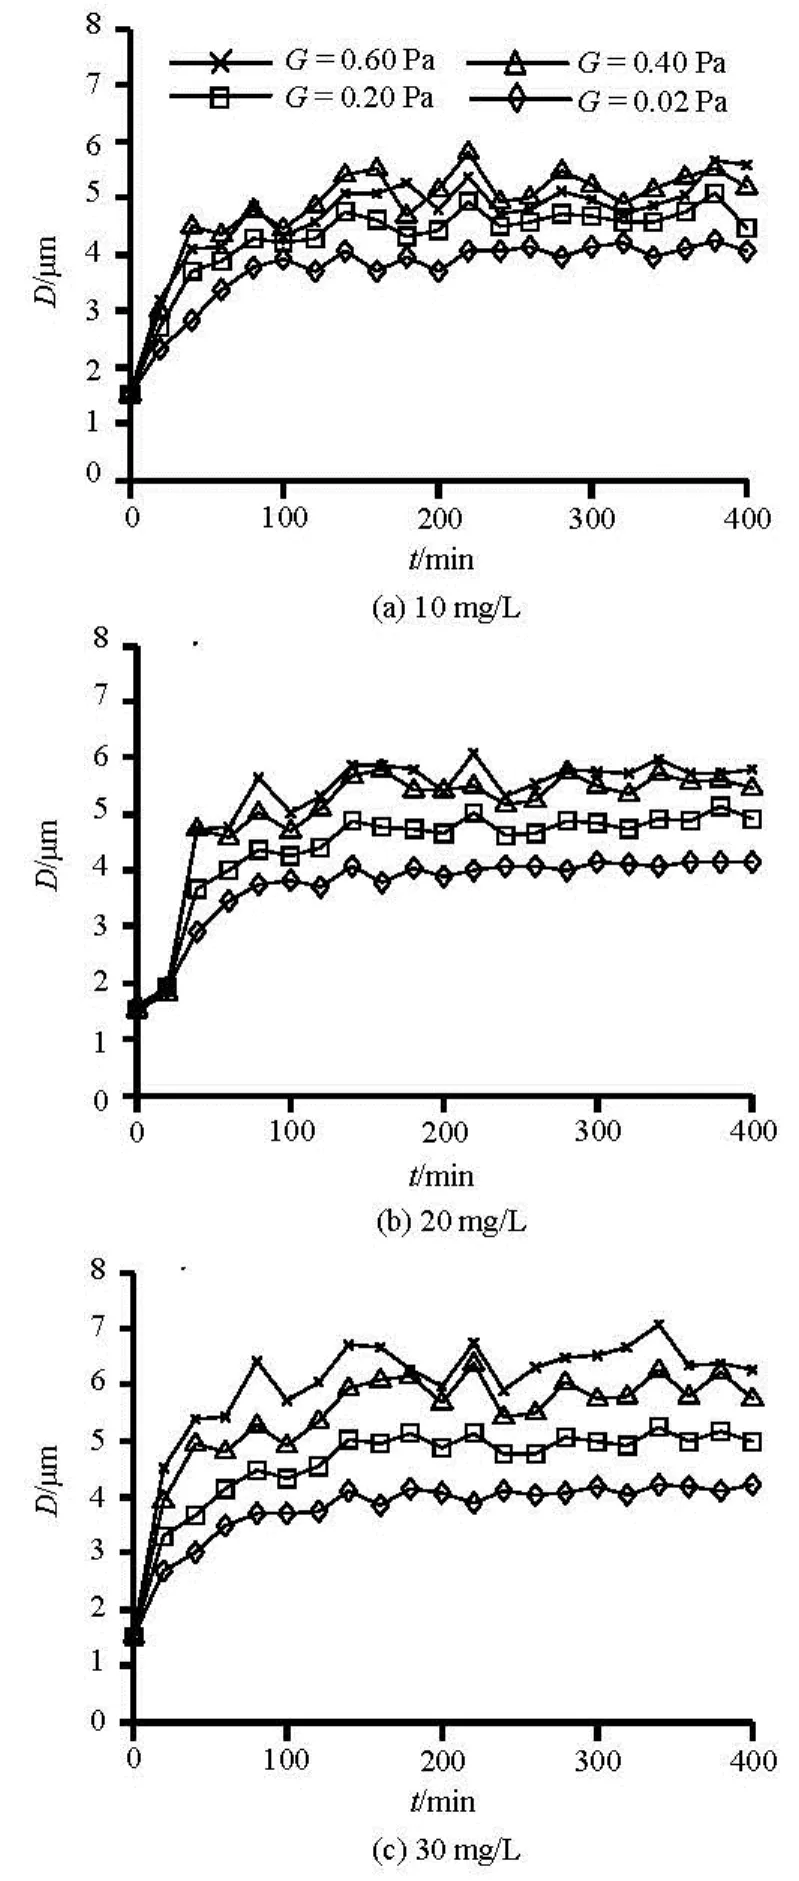
Fig.5 Median floc diameter as a product of fluid shear and PAC
A PAC settling velocity formula could be further yielded by fitting the experimental results with empirical expressions based on fractal theory. Based on the theory, the settling velocity can be generalized into
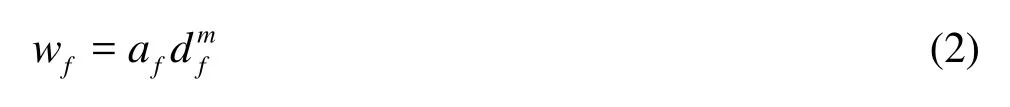
wherewfis the settling velocity of PAC floc,dfis the dynamic median floc size, andafandmare calibrated coefficients.
According to the data sets of PAC still water deposition (see Fig.4), the PAC settling rate is given in Table 1, corresponding to an initial PAC median size of 1.5 μm. The PAC floc settling rate under shear stress of 0.02 Pa, could be determined directly from initial slope ofC(t) graph, corresponding to PAC floc median size of 2.8 μm. Based on the two scenarios, it is found that the formula like the expression by Krishnappan and Marsalek[4]could result in the best fit, that is,
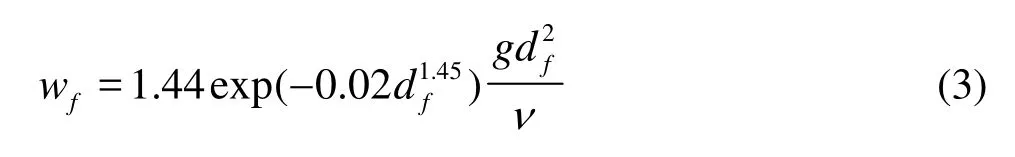
whereνis the kinematic viscosity of fluid.
(3) The long-time (steady-state) concentration increases as the shear stress increases. The reason is that the PAC floc size ranges from a single particle (2 μm) to approximate 6 μm instead of the magnitude of larger than 100 um or even several millimeters, which indicates the effects of flocculation on settling speeds may not be significant within the range of experimental scenarios. Therefore, as the average shear stress increases, an increase of instantaneous turbulent fluctuations counteracts the force of PAC floc settling downward, and as a result the steady PAC concentration increases gradually. For both deposition scenarios, when the average shear stress reaches approximate 0.60 Pa, the PAC deposition would be insignificant, but it suspends in water for a long time.
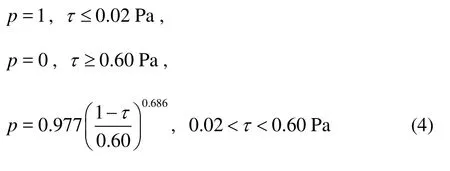
(4) Based on above discussions, we can further give the expression to depict PAC deposition probability related with actual fluid shear. The expression satisfies the condition that when the actual shear stress is smaller than 0.02Pa, then all of the initial PAC is deposited, i.e., the probability equals one. When the actual shear stress is greater than 0.60 Pa, then none of the initial PAC deposit exists, i.e., the probability is equal to zero. When the actual shear stress is within these two limits, the probability of PAC deposition is given by the power function below
3. Conclusions
In this study, a rotating circular flume has been employed to investigate the PAC transport with water flow, under the experimental scenarios of PAC initial concentration of 10 mg/L-30 mg/L. The results can be summarized as follows:
(1) During the deposition process, PAC agglomerates as floc from an initial PAC size of 1.5 μm to a PAC floc size of 3 μm-6 μm, influencing PAC deposition speed under low shear stress. In this case, whenthe fluid shear falls to 0.02 Pa, PAC depletes to bed much faster than that in the still water.
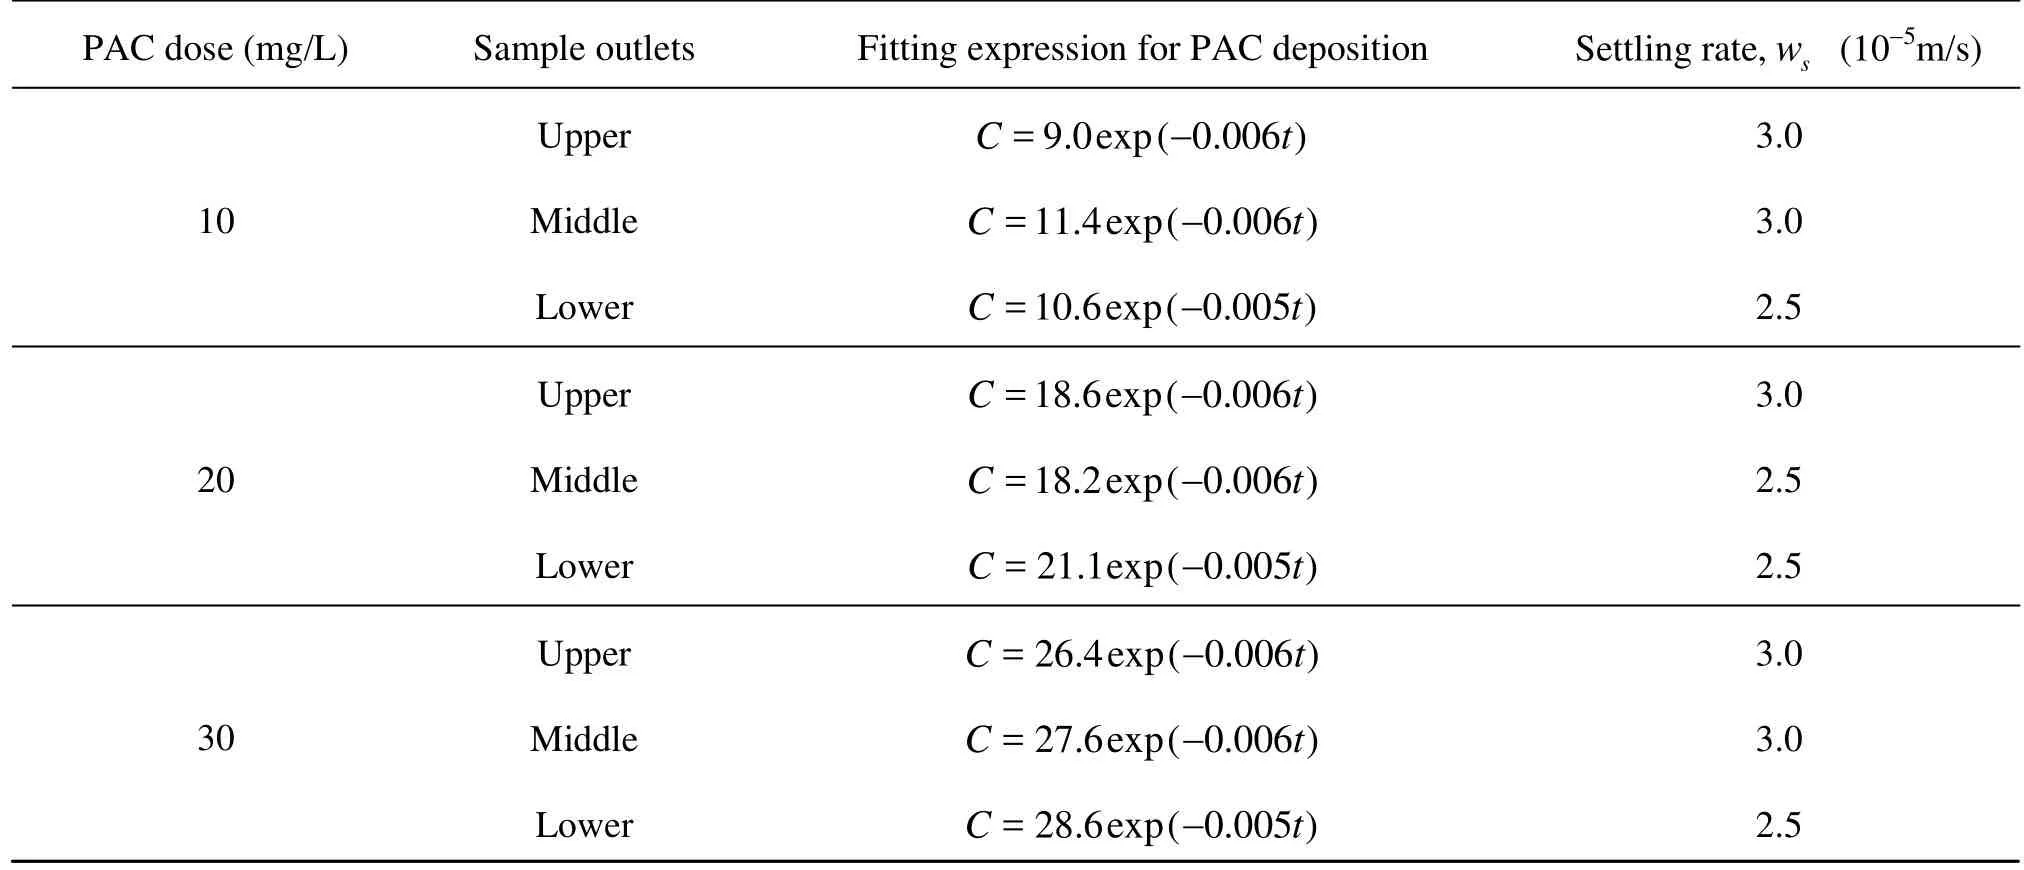
Table 1 Derivation of PAC settling velocity in still Water
(2) Due to less PAC flocculation effect under the experimental scenarios, as the fluid shear increases, an increasing of instantaneous turbulent fluctuations could counteract the force of PAC floc settling downward, and as a result the steady PAC concentration increases with the increase of shear stress. It is found that the critical shear stress for PAC deposition is about 0.60 Pa, and further the PAC deposition probability is derived according to the experimental scenarios between 0.02 Pa and 0.60 Pa.
It is clear that the dynamics of PAC are influenced by flow regimes, PAC concentration, and PAC flocculation incorporated as well, which decide the PAC deposition probability. Combining the PAC transport and deposition formula with PAC-pollutant removal model could provide an insight into PAC deployment in raw water aqueduct for sudden pollution of open water source.
[1] LICK W. Sediment and contaminant transport in surface waters[M]. USA: CRC Press, 2009.
[2] YANG Tie-sheng, XIONG Xiang-zhong and ZHAN Xiu-ling et al. On flocculation of cohesive fine sediment[J]. Hydro-Science and Engineering, 2003, (2): 65-67(in Chinese).
[3] CHAI Zhao-hui, YANG Guo-lin and CHEN Meng et al. Simulation of flocculation-settling for cohesive fine sediment in still water[J]. Journal of Sichuan University (Engineering Science Edition), 2012, 44(Suppl. 1): 48-53(in Chinese).
[4] KRISHNAPPAN B. G., MARSALEK J. Modelling of flocculation and transport of cohesive sediment from an on-stream stormwater detention pond[J]. Water Research, 2002, 36(15): 3849-3859.
[5] LARTIGES B. S., DENEUX-MUSTIN S. and VILLEMIN G. et al. Composition, structure and size distribution of suspended particulates from the Rhine River[J]. Water Research, 2001, 35(3): 808-816.
[6] LI Fu-gen, XIONG Xiang-zhong and ZHAO Ming et al. Floc structure and fractal dimension of cohesive sediment[J]. Yellow River, 2006, 28(2): 31-32(in Chinese).
[7] AHN J. H. Size distribution and settling velocities of suspended particles in a tidal embayment[J]. Water Research, 2012, 46(10): 3219-3228.
[8] CHEN Xiao-hong, CHEN Yong-qin and LAI Guo-you. Modeling transportation of suspended solids in Zhujiang River estuary, South China[J]. Chinese Journal of Oceanology and Limnology, 2005, 23(1): 1-10.
[9] JIN Wen, WANG Dao-zeng. Direct settling velocity detection of sediment using PIV[J]. Chinese Journal of Hydrodynamics, 2005, 20(1): 19-23(in Chinese).
[10] COUFORT C., DUMAS C. and BOUYER D. et al. Analysis of floc size distributions in a mixing tank[J]. Chemical Engineering and Processing: Process Intensification, 2008, 47(3): 287-294.
[11] MAGGI F., MIETTA F. and WINTERWERP J. C. Effect of variable fractal dimension on the floc size distribution of suspended cohesive sediment[J]. Journal of Hydrology, 2007, 343(1-2): 43-55.
[12] BOUYER D., LINE A. and COCKX A. et al. Experimental analysis of floc size distribution and hydrodynamics in a jar-test[J]. Chemical Engineering Research and Design, 2001, 79(8): 1017-1024.
[13] COLOMER J., PETERS F. and MARRASE C. Experimental analysis of coagulation of particles under lowshear flow[J]. Water Research, 2005, 39(13): 2994-3000.
[14] ZHU Zhong-fan, YANG Tie-sheng and ZHAO Ming et al. Preliminary study on the critical criterion for distinguishing floc sedimentation and gel-like network sedimentation[J]. Journal of Sediment Research, 2009, (1): 20-26(in Chinese).
[15] ZHU Zhong-fan, ZHAO Ming and YANG Tie-sheng. Review on experimental research on effect of shear flow on flocculation of cohesive sediment[J]. Journal of Sediment Research, 2010, (4): 73-80(in Chinese).
[16] ZHOU Hai, RUAN Wen-jie and JIANG Guo-jun et al.A flume experiment on flocculation settling of finegrained sediment in moving water[J]. Oceanologia et Limnologia Sinica, 2007, 38(2): 124-130(in Chinese).
[17] ZHOU Jing-jing, ZHANG Chang-kuan and JIN Ying. Experimental research on cohesive fine sediment of the South Passage in the Yangtze estuary by two-way annular flume[J]. Yangtze River, 2008, 39(16): 48-51(in Chinese).
[18] ZHANG Jin-xing, LIU Hua. A Vertical 2-D numerical simulation of suspended sediment transport[J]. Journal of Hydrodynamics, Ser. B, 2007, 19(2): 217-224.
[19] DROPPO I. G., KRISHNAPPAN B. G. and LISS S. N. et al. Modelling sediment-microbial dynamics in the South Nation River, Ontario, Canada: Towards the prediction of aquatic and human health risk[J]. Water Research, 2011, 45(12): 3797-3809.
[20] ZHANG Yue, ZHANG Xiao-jian and CHEN Chao. Technical guideline on emergency water purification techniques for urban drinking water supplies (trial implementation)[M]. Bejing, China: China Construction Industry Press, 2009(in Chinese).
10.1016/S1001-6058(13)60424-2
* Project supported by the National Natural Science Foundation of China (Grant No. 11102137).
Biography: YIN Hai-long (1976-), Male, Ph. D.,
Associate Professor
猜你喜歡
Chinese Physics B(2022年8期)2022-08-31 09:55:28
民間故事選刊(2022年16期)2022-08-23 14:01:10
加油站服務(wù)指南(2022年5期)2022-06-02 04:14:16
小學(xué)生必讀(低年級(jí)版)(2021年9期)2021-12-29 08:00:40
政工學(xué)刊(2021年12期)2021-12-22 08:40:28
政工學(xué)刊(2021年11期)2021-11-01 01:08:56
天工(2021年2期)2021-03-03 07:29:16
小哥白尼(野生動(dòng)物)(2019年4期)2019-09-10 07:46:20
作文大王·低年級(jí)(2018年9期)2018-10-24 11:01:08
作文周刊·小學(xué)二年級(jí)版(2018年9期)2018-04-18 10:01:40
 水動(dòng)力學(xué)研究與進(jìn)展 B輯2013年5期
- 水動(dòng)力學(xué)研究與進(jìn)展 B輯的其它文章
- Hydrodynamic effects on contaminants release due to rususpension and diffusion from sediments*
- The influence of the flow rate on periodic flow unsteadiness behaviors in a sewage centrifugal pump*
- Practical evaluation of the drag of a ship for design and optimization*
- Inverse problem of bottom slope design for aerator devices*
- Assessment of ship manoeuvrability by using a coupling between a nonlinear transient manoeuvring model and mathematical programming techniques*
- Generation and evolution characteristics of the mushroom-like vortex generated by a submerged round laminar jet*