BLADE SECTION DESIGN OF MARINE PROPELLERS WITH MAXIMUM CAVITATION INCEPTION SPEED*
ZENG Zhi-bo
China Ship Scientific Research Center, Wuxi 214082, China, E-mail: zbzeng80@gmail.com KUIPER Gert
Soetendaalseweg 106721 XB, Bennekom, The Netherlands
BLADE SECTION DESIGN OF MARINE PROPELLERS WITH MAXIMUM CAVITATION INCEPTION SPEED*
ZENG Zhi-bo
China Ship Scientific Research Center, Wuxi 214082, China, E-mail: zbzeng80@gmail.com KUIPER Gert
Soetendaalseweg 106721 XB, Bennekom, The Netherlands
(Received August 23, 2011, Revised November 17, 2011)
Kuiper and Jessup (1993) developed a design method for propellers in a wake based on the Eppler foil design method. The optimized section is transformed into the three-dimensional propeller flow using the approach of the effective blade sections. Effective blade sections are two-dimensional sections in two-dimensional flow which have the same chordwise loading distribution as the three-dimensional blade sections of a propeller. However, the design procedure is laborious in two aspects: finding an optimum blade section using the Eppler program requires much skill of the designer, and transforming the two-dimensional blade section into a propeller blade section in three-dimensional flow is complex. In this work, these two problems were coped with. A blade section design procedure was presented using an optimization technique and an alternative procedure for the effective blade section is developed using a lifting surface design method. To validate the method a benchmark model of a naval ship was used. This benchmark model was extended by new appendices and a reference propeller, and designed using conventional design methods. This reference propeller was optimized using the new design procedure and model tests were carried out. Special attention was given to the data of the model and the reference propeller, to make the configuration suitable for the Reynolds-Averaged Navier-Stokes (RANS) calculations.
blade section, Eppler foil design method, genetic algorithm, cavitation inception, high speed cavitation observation
Introduction
Cavitation is a key subject of ship propeller design. In many cases, such as in designing naval ships, it is necessary to delay cavitation up to the highest possible ship speed. Traditionally the margin against cavitation is increased by increasing the blade area. However, this leads to thin and wide sections which reduces the ability of the blades to adapt to wake variations without cavitation. Furthermore, increasing the blade area reduces the propeller efficiency. To move cavitation inception to the highest possible ship speed it is necessary to control the pressure distribution on the propeller blades at all blade positions in a wake. This requires optimization of the blade sections at all angles of attack that are encountered during a propeller revolution. The range in which a profile or a blade section can operate without cavitation is expressed in graphical form by a “cavitation bucket”.
Kuiper and Jessup[1]developed an integrated non-cavitating propeller design method for the unsteady condition. The method was based on the use of the Eppler foil design method and validated by model tests and full-scale trials. Wang and Wang[2]studied effects of blade section parameters on cavitation characteristics by the Eppler design method. Zhou[3]also designed new blade sections and verified the results for a ship propeller. The model test results showed that the new section design method increased the cavitation inception speed of the ship. Dang[4]investigated new blade sections with wider bucket and their application in commercial vessels and indicated it was possible to improve cavitation behavior and reduce pressure pulse levels of propellers with the new blade section design. Makiakov et al.[5]designed hydrofoils with a given pressure envelope with their pressure envelope theory.
Performance optimization has become one of the trends in hydrodynamics. Xu et al.[6]developed a twodimensional hydrodynamic and quality model to optimize the design of a natural ecological wastewater treatment system. In order to investigate the effect of side hulls for trimaran on wave loads, Xu and Zhang[7]carried out a parametric optimization for different layouts and lengths of side hulls.
The authors focus on propeller blade section design optimization. In general, an optimization model consists of three parts: a parametric representation of the foil, a simulation method and an optimization strategy. In recent years, a number of studies were carried out with respect to the foil design optimization model. Hsin et al.[8]defined a foil geometry by the B spline and utilized the Reynolds-Averaged Navier-Stokes (RANS) approach to simulate the viscous flow. They developed an optimization method by using the Lagrange multiplier method. Black et al.[9]developed a seven-parameter model which could represent sub-cavitating and super-cavitating foils. They predicted the pressure distribution and corresponding forces as well as the cavity shape with the potential theory and computed flow separation and viscous drag with an integral boundary layer solver. Barrett et al.[10]replaced airfoil section shape parameters with section pressure distributions, which can reduce the number of design variables in optimization. An inverse design code was employed to recover the corresponding airfoil shape. A Genetic Algorithm (GA) was used to optimize the pressure profile for minimum drag. Apart from the above-mentioned work, optimization was also studied in more complicated cases. Gandhi et al.[11]studied a flexible airfoil with a shape optimization approach and Qian et al.[12]analyzed the optimum shape of a two-dimensional undulating plate in a complex fluid flow.
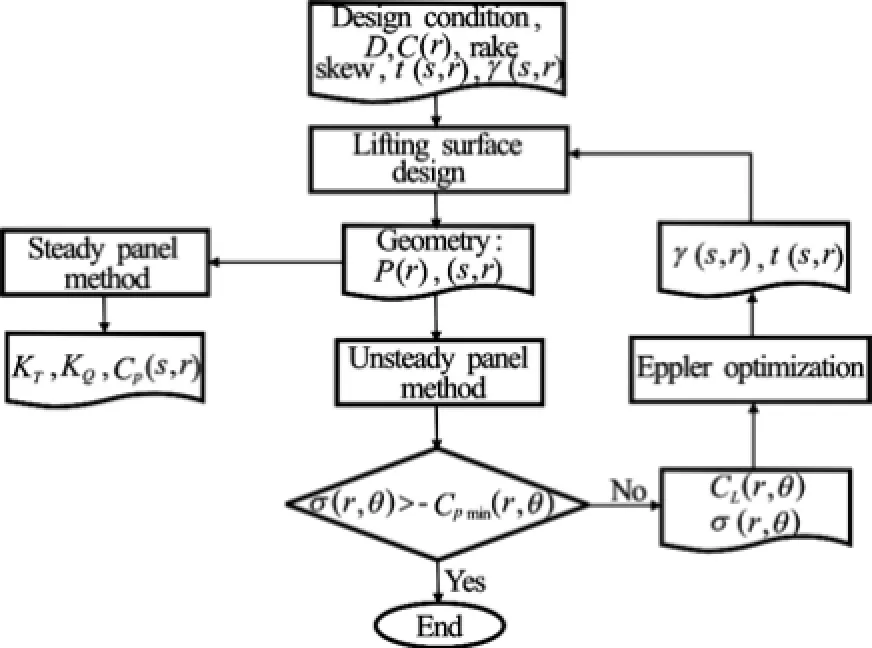
Fig.1 Flowchart of propeller design
The present article follows the design method as developed by Kuiper and Jessup[1], but improves the way in which the Eppler foil design method is used by an optimization technique and follows a different and easier way to deal with the transformation of the twodimensional effective profile into a propeller blade section.
1. Blade section design
1.1 Design philosophy
The design flowchart of the propeller blade section is shown in Fig.1.The design cycle starts with the choice of an attainable inception speed for a given ship. This is an estimation process and the optimization cycle in the design will show if this choice was either too low or too high. In the following this speed will be called the design speed.
The first step in the design cycle is the design of an initial propeller. The thrust, rotation rate, the propeller inflow (wake distribution), the blade contour (which implies diameter, skew and blade area), the radial loading distribution and the rake distribution are chosen as the objectives on the basis of expected or required propeller performance. These are input parameters for the present design process and they are only changed when the results of the design process need further improvement. Initial values are chosen for the chordwise loading distribution, which may differ per radius but is generally taken the same at all radii. This distribution can be taken from “standard distributions” such as the National Advisory Committee for Aeronautics (NACA) camber distributions. The pitch and camber distribution of the initial propeller are then obtained using a lifting surface design approach. The geometry of the initial propeller is then found by adding an initial thickness distribution, which also may be taken from a NACA profile. The hydrodynamic characteristics of this initial propeller, with a hub added, is analyzed with a surface panel method in uniform inflow. This is done to check the thrust. The lift coefficient at every radius can be obtained by integrating the pressures calculated with the surface panel code. The unsteady performance of the initial propeller is evaluated with an unsteady panel method at the (corrected) design speed in the wake. The focus is on the minimum pressure at any blade position. If this minimum pressure is lower than the vapor pressure, cavitation will appear, and further improvement is necessary to bring the inception speed to the design speed.
This improvement goes as follows. From the calculation with the unsteady panel method, the lift coefficients and cavitation indices at the blade position are obtained at or near the radius with the minimum pressure. This radius can be assumed to be the most critical for the inception speed. These values are used to form the operating curve at this radius. A new blade section is then designed using the method presentedby Eppler. In this article an optimization method is described to obtain a section with a cavitation bucket which envelopes the operating curve. If such a section exists, then the optimization proceeds. If not, it is indicated that the assumed inception speed has been taken too high. The resulting new blade section is separated into a camber and thickness distribution in a linearized way. Then the first step of the design cycle is repeated, but now with the new camber and thickness distribution. Instead of the initial propeller the first optimization is then found. This iteration is completed when the camber and thickness distributions converge. Generally only a few cycles are necessary. The use of the lifting surface design code in this way is an alternative to the use of a two-dimensional effective profile and is more efficient when the propeller codes are available. Figure 2 shows a two-dimensional camber distribution as designed with the Eppler method from the operating curve and the camber distributions of the propeller as derived from the effective profile approach with lifting surface corrections and the present lifting surface design approach. The resulting camber distributions of both approaches are nearly the same. The minimum pressure on the newly designed propeller in the wake is checked using an unsteady panel calculation. If the minimum pressure at a radius different from the optimized radius is still lower than the vapor pressure this other radius will be optimized until the pressure on the propeller remains higher than the vapor pressure at all radii and in all blade positions. If there is a margin between the minimum pressure and the vapor pressure the inception speed can be further increased.

Fig.2 Comparison of different camber distributions
1.2 Optimization of blade section design
The program of Eppler-Shen is used in the new blade section design. Optimization using such a routine is difficult. A routine for automatic and convenient optimization has been developed, using the commercially available program iSIGHT, which gives the desired blade section with sufficient accuracy. The Eppler code describes a profile by ten parameters:1φ, 1α,2α,3φ,3α,4φ,4α,5α, u, k. The detailed description of the input parameters can be found from Kuiper and Jessup[1].
The objective of the optimization is to design a section with a cavitation bucket which envelopes the operating curve (see Fig.3). The cavitation bucket indicates the region where no cavitation occurs and is a property of a blade section. The operating curve has been calculated by the unsteady panel code. The optimization objective has been expressed in the three variables:1dα,2dα and dcp. The value1dα is the vertical distance between the cavitation bucket and the lowest point of the operating curve. It gives the margin against pressure side sheet cavitation. The value2dα is the vertical distance between the cavitation bucket and the highest point of the operating curve. This value gives the margin against suction side sheet cavitation. Similarly the value dcp depicts the minimum horizontal distance between the operating curve and the bucket and it depicts the margin against suction side bubble cavitation.
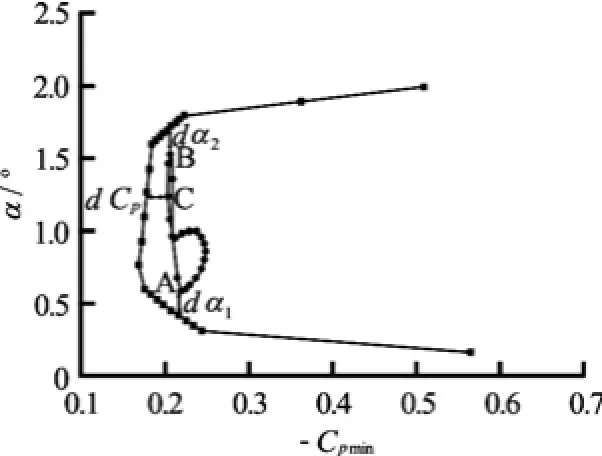
Fig.3 A typical operating curve and cavitation bucket
The optimization problem is formed with a constraint of maximum thickness:maxT of foils as follows,

where X is the combination of parameters, C is a space of parameters,limT is the limit of maximum thickness of section.
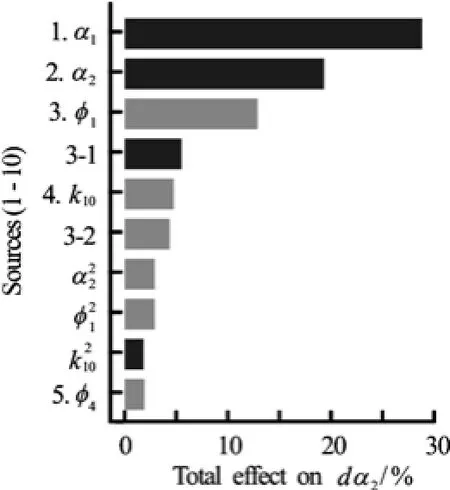
Fig.4 Pareto for the impact of design variables on2dα
The iSIGHT uses orthogonal arrays to generate a set of designs within specified parameter ranges. This orthogonality allows for the independent estimation of factors and interaction effects from the entire set of experimental results. When there is a strong dominance of some parameters on the objectives, this procedure saves much time in the optimization. The automation of this procedure in the iSIGHT allows a designer with little knowledge of orthogonal arrays to efficiently and effectively study the design space. Figure 4 shows the Pareto for the impact of the top 10 parameters on the object. In the figure the fuscous bars represent a positive effect and the light a negative effect on the object. The top 10 parameters are not only the independent ones, such as,,, k,, but also the interaction terms, for example, “3-1”in Fig.4 denotes the effect of the interaction terms:andon.
In order to optimize the design variables the objectives are translated into one fitness parameter with suitable weight for each of the design objectives. A GA optimization method is used to generate a new better population. Optimizations are processed by means of genetic operators, including crossover, mutation and selection. In the section optimization, it is enough to set population size at 10, and after about 30 generations the optimized solution is obtained. The time to optimize a section is less than 10 min, so it takes less than half an hour to design 3 sections for a propeller. The final generation has some individuals with optimum fitness.
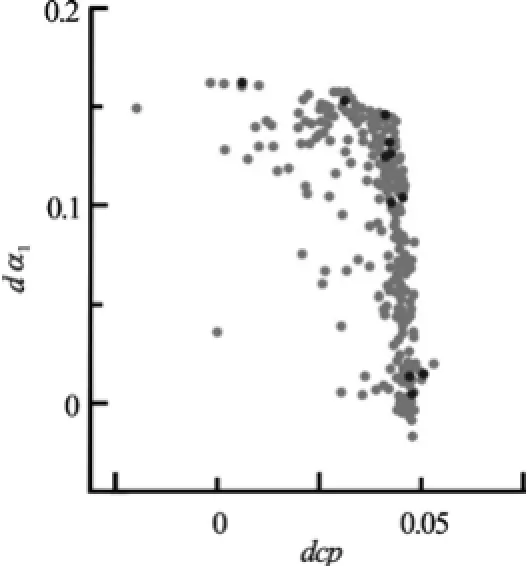
Fig.5 Pareto: distribution in the objective space of all the individuals
The best solution for a multi-objective optimization problem is often a trade-off, so a Pareto optimum is used instead of finding only one solution. There is a series of feasible and non-dominated solutions in the Pareto. In the section optimization, there are three Paretos:and,and dcp,and dcp. Figure 5 shows the Pareto forand dcp. In the figure there are all the individuals in every generation during the process of optimization in which the fuscous dots are the final optimum individuals and designers can select a suitable one according to practical requirements.
2. Design of reference case
To apply and illustrate the method a specific ship of twin screw frigate type has been used: the DTMB model 5415. This model has been used as a benchmark for flow calculations and wave calculations[13-15]. The data of this model do not include a realistic propeller and realistic struts. Therefore a reference propeller was designed with a good cavitation behavior using a standard conventional design method. It is our aim to use this reference propeller also for the validation of the RANS calculations of propellers. In this article this reference propeller is used to optimize the inception speed of sheet and bubble cavitation. The design of a reference propeller was carried out using standard NACA sections.
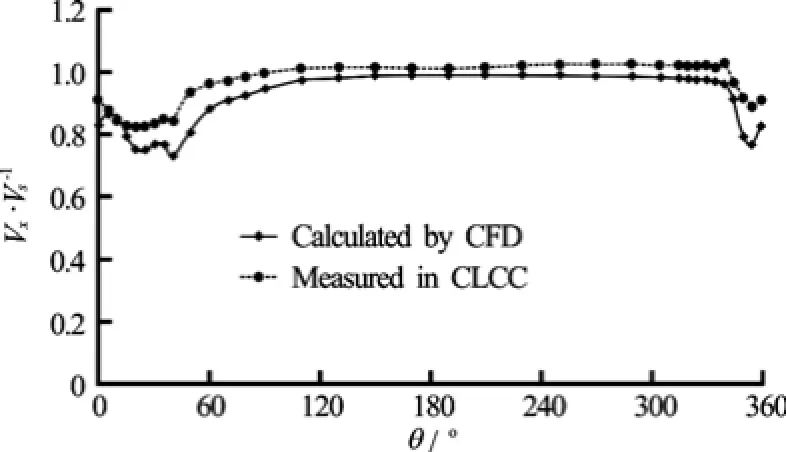
Fig.6 Comparison of the calculated and measured axial wake distributions at 0.7R

Fig.7 Comparison of the calculated and measured axial wake distributions at 0.9R
2.1 Wake distribution
The three-dimensional wake was obtained from the RANS calculations of the appended hull with shafts and struts. The calculated axial wake has been compared with test results in a China Large Cavitation Channel (CLCC) of CSSRC in Wuxi. The waterline length of the model 5415 is 5.72 m and the velocity ofthe channel flow is about 3.3 m/s in the wake measurement. The results at 0.7R and 0.9R are shown in Figs.6-7. It can be seen that the calculated axial wake has the same distribution as the measured one, but it has a slightly deeper wake peak. The calculated three-dimensional wake was used to design propellers in the present article and the accuracy was enough for the propeller design.

Fig.8 Calculation results and observations of the original strut in the left and the redesigned strut in the right
2.2 Strut design and alignment
The original strut of model 5415 in the benchmark was found to be very sensitive to cavitation when initial cavitation observations at full speed were carried out in the cavitation channel. The cavitation index based on the flow in the channel is in the range of 1.01.05σ≤≤ along the struts, and the propelleron the struts and the flow field around the strut sections was calculated using the Fluent 6.3. The propeller forces were represented by body forces, distributed according to Paterson[16]. The photo on the left of Fig.8 shows the cavitation on the original inner strut. The calculated pressure is indeed lower than the vapor pressure. In many conditions the strut cavitation interfers with the cavitation on the propeller, so it is necessary to improve the strut design.
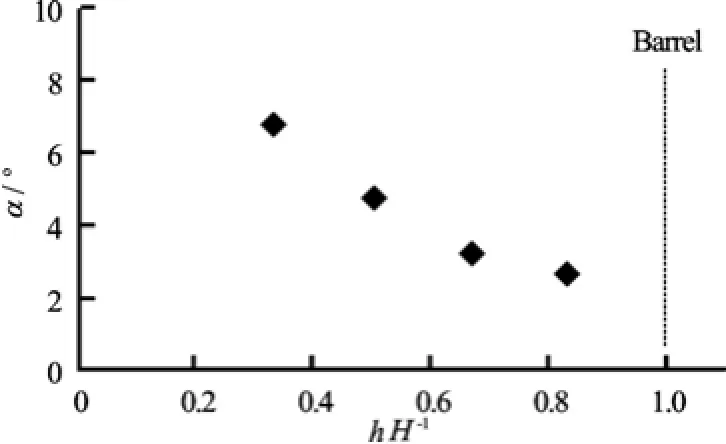
Fig.9 Inflow angle for the inner strut’s sections
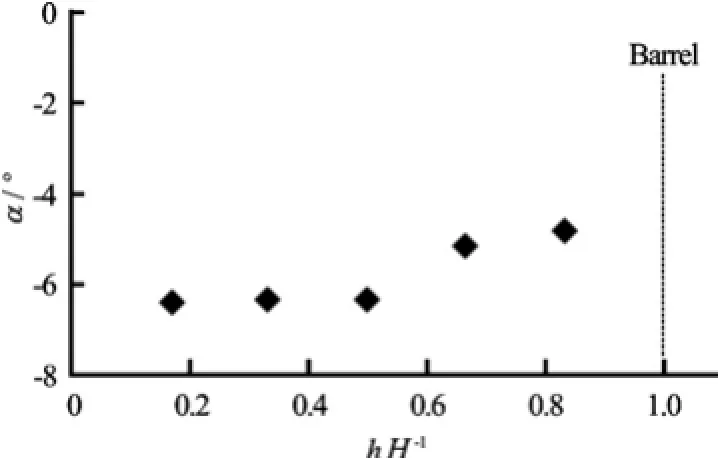
Fig.10 Inflow angle for the outer strut’s sections
The angle of attack of the inner and outer struts (Fig.8) can be extracted from the calculations when the velocities induced by the strut is neglected. The results are shown in Figs.9-10. The inflow angle is positive anticlockwise seen from the top. It can be found that the inflow angle decreases with increasing distance to the hull. The direction of inflow angle is opposite between the two struts.
To arrive at an optimum strut configuration the struts should be twisted. However, for manufacturing reasons the redesigned strut has been made without twist. The new orientation of the strut has been taken as the average of the minimum and maximum angles in Figs.9 and 10. The operating curves for the strut sections are shown in Fig.11. Although most of the sections are in the bucket of the original section, thereare still some above the bucket of the original section and the cavitation margin is very small. Therefore the strut section has been replaced by Profile-B from Shen[17]with the same maximum thickness as the original section. The inception margin is increased significantly, as shown in Fig.11. The alignment of the original and the new strut is shown in Fig.12. The installation angle of the inner strut is adjusted from 0oto 4.73o, the outer strut from 3.27oto –5.6o.

Fig.11 Buckets of the original and the new strut profiles and operating curves of the adjusted struts
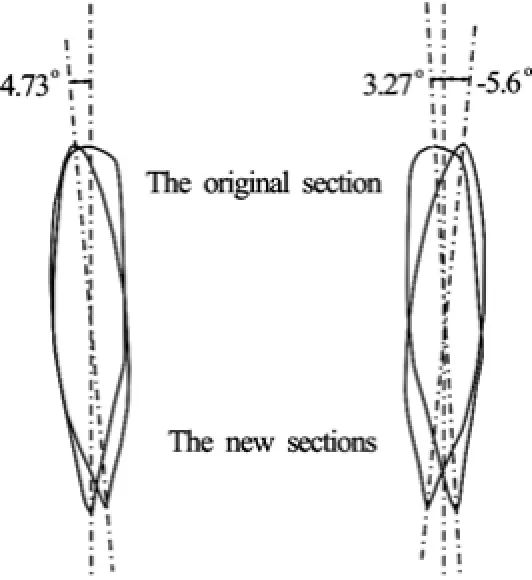
Fig.12 Original and the new strut alignments on the starboard

Fig.13 Measured hydrodynamic performance of the reference propeller model and of the new propeller with optimized sections in behind condition
The pressure distribution on the new struts at the new installation angle is calculated again with propellers as the original struts by Fluent 6.3 and shown in Fig.8. The pressure coefficient is increased significantly, from –1.45 to –0.7 and there is no longer any cavitation.
2.3 Unsteady performance of the reference propeller
The hydrodynamic performance of the reference propeller in the condition measured in the CLCC is shown in Fig.13. The design speed at which the reference propeller is to be optimized is chosen as 26 kn. The thrust coefficientTK at the design speed isthe top position) is 0.192.
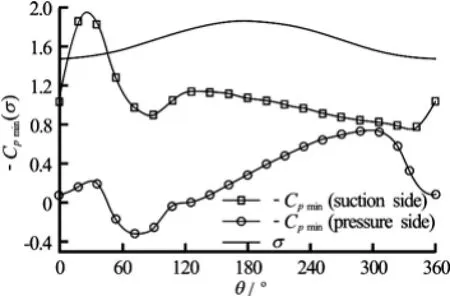
Fig.14 Cavitation index and the minimum pressure coefficient of the reference propeller (design speed, 0.8R)
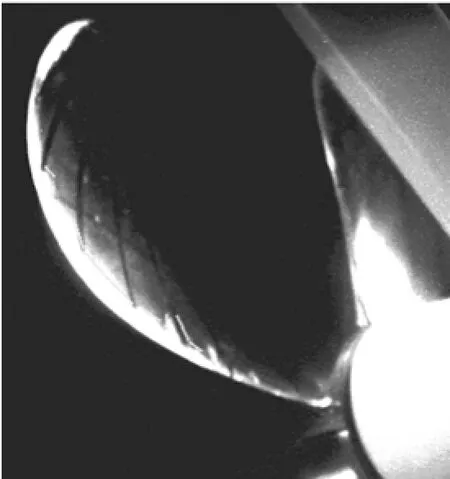
Fig.15 High-speed video observation on the reference propeller model at the design speed of 26 knots in a blade position of 36o(The cavitation extent is enhanced)
The unsteady performance of the reference propeller in the wake at this speed was calculated using an unsteady panel method. The cavitation index and the calculated minimum pressure coefficient at 0.8R are shown in Fig.14. The minimum pressure coefficient is lower than the cavitation index in the blade positions from the top until 50obeyond the top. These calculated results were validated by model test in the CLCC. Figure 15 shows a high speed video observation of the reference propeller model. Sheet cavitation occurs from the leading edge on the suction side between 0.6R and 0.9R at a blade position of 36o. The observations confirmed the blade positions at which cavitation appeared.

Fig.16 Optimized bucket and operating curves at 0.6R

Fig.17 Optimized bucket and operating curves at 0.8R
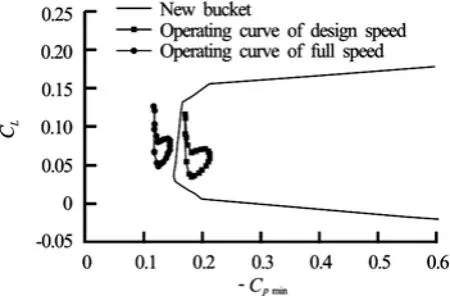
Fig.18 Optimized bucket and operating curves at 0.9R
3. Redesign for maximum inception speed
3.1 New blade sections
According to the unsteady performance of the reference propeller, cavitation occurred at the design speed of 26 kn. A section optimization was therefore carried out to maximize the inception of the propeller. Three blade sections 0.6R, 0.8R and 0.9R were selected to be optimized. Their operating curves calculated by an unsteady panel code of the reference propeller at the design (inception) speed of 26 kn and at full speed of 30 kn are shown in Figs.16 to 18.
The new section design optimization for the three radii were carried out as described in this article. By maximizing the margins against sheet cavitation and bubble cavitation on the suction side and sheet cavitation on the pressure side, the optimized buckets were obtained. The results are shown in Figs.16-18. They all have four “corner-points” which enlarges the bucket width. The buckets envelope the operating curves at the design speed with some margin. For the reasons of fairing of the propeller blade it is important to keep the three optimized sections with similar shape. The new two-dimensional sections are shown in Fig.19. They show similar thickness and camber distribution. The maximum thickness is moved towards the leading edge, increasing the margins against sheet cavitation on both pressure and suction side. The camber is moved towards the trailing edge, moving the loading towards the trailing edge.
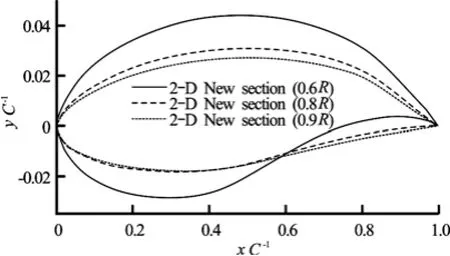
Fig.19 Optimized two-dimensional sections at 0.6R, 0.8R and 0.9R
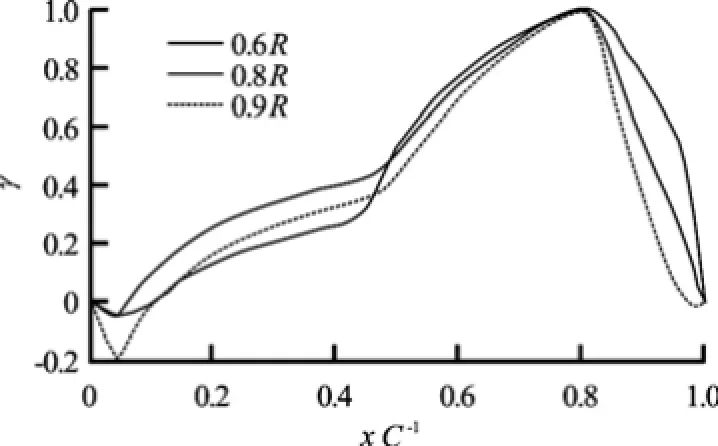
Fig.20 Chordwise load distribution of the new propeller
3.2 New propeller design with optimized blade sections
The reference propeller and the strut design also meant to be a basis for future calculations and optimizations. The details of this design are available from the work of the first author. The new propeller is designed by lifting surface method in the same condition as the reference one: a ship speed of 32 kn and a thrust coefficient of 0.21. The only part changed is the chordwise loading distribution at each radius as shown in Fig.20. The loading distributions for 0.6R, 0.8R and 0.9R in Fig.20 come from the pressure difference on the new two-dimensional sections at their design lift coefficients. The design lift coefficient at every radius is the same as the reference propeller and is calculated by integrating the pressure from steady panel code at the corresponding radius. These loading distributions have the same shape with the main loading aft. It is not difficult to interpolate and extra-polate these loading distributions to other radii. With these chordwise load distributions, the new propeller was designed using a lifting surface design code (in uniform inflow).

Fig.21 Radial distribution of the maximum thickness of the reference propeller and the new propeller
The new propeller has a new radial distribution of pitch and maximum camber. The thickness distribution of the blade can be obtained by interpolation and extrapolation from 0.6R, 0.8R and 0.9R. Figure 21 shows the radial thickness distribution of the new propeller and the reference propeller. The new thickness is larger, which makes the blade section less sensitive to inflow variations in the wake. The blade contour of the reference propeller is maintained. In general, the pitch of the new propeller is decreased and the maximum camber is increased, because the zero lift angle of the new section is larger than that of the standard NACA section of the reference propeller.
Figure 13 gives the hydrodynamic performance in behind condition of the new propeller. The values ofTK andQK are both slightly lower than those of the reference propeller. The difference is very small and the new propeller has the same hydrodynamic performance.

Fig.22 Cavitation index and the minimum pressure coefficient of the new propeller (at design speed, 0.8R)
3.3 Unsteady performance of the new propeller
The unsteady performance of the new propeller was calculated in the same way as for the reference propeller using an unsteady panel code. Figure 22 shows the cavitation index and the calculated minimum pressure coefficient at the design speed (26 knots) at any blade position at 0.8R. Compared to the reference propeller, the minimum pressure is higher than the vapour pressure at all blade positions and thus no cavitation is expected to occur.
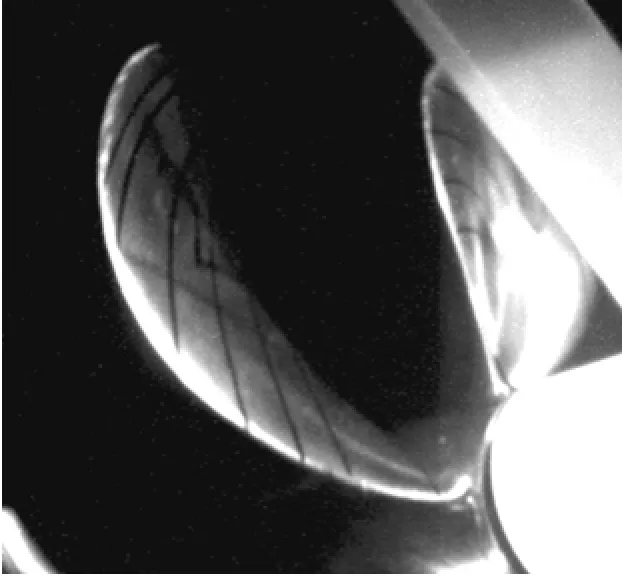
Fig.23 High-speed video observations on the new propeller model at design speed
The inception performance of the new propeller was confirmed in model tests in the CLCC. Figure 23 is in the same condition and blade position as Fig.15 and shows that there is no sheet cavitation from 0.6R to 0.9R on the blade of the new propeller at the inception design speed.
4. Cavitation behavior investigation on the designed propellers
In model testing of propellers, cavitation is assumed to occur when the local pressure becomes equal to the vapor pressure and the scaling law (pressure coefficient equals cavitation index) is utilized to predict inception on the prototype from model test results. In model tests, however, the local pressure at inception is often different from the vapor pressure and also the cavity pressure can deviate from the vapor pressure. These deviations from the scaling law are called scale effects. One of the causes of such scale effects is viscosity, which requires maintaining the Reynolds number between model and full scales.
It is difficult (or impossible) to maintain the ship Reynolds number at model scale. It is sometimes assumed that a minimum Reynolds number in cavitation test is sufficient to avoid scale effects, as is also done in the determination of the hydrodynamic performance of propellers. However, it still requires a very high sectional Reynolds number, up to about 5×10⁶, which is much higher than the critical value of 3×10⁵often used for proper scaling of the hydrodynamic performance. Laminar boundary layer flow near a low mimimum pressure region suppresses cavitation inception at model scale and that artificial roughness is used to make the boundary layer turbulent, as is thecase at full scale.
4.1 Cavitation inception
Inception measurements were carried out in the CLCC as well as the cavitation tunnel for both the reference propeller and the new propeller with optimized blade sections. The waterline length of the ship model is 6.65 m and the diameter of the reference and new blade section propeller models is 0.25 m.
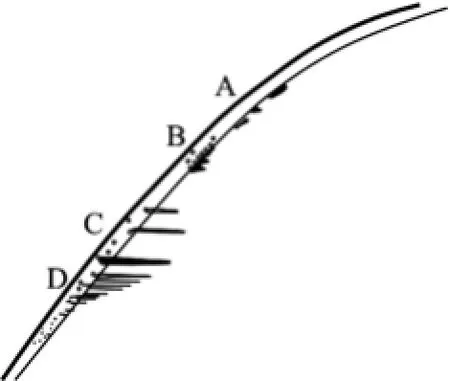
Fig.24 Scheme of leading edge roughness
When it was firstly carried out in the condition provided by the CLCC in 2009, another source of inaccuracy was revealed: the determination of inception on roughness elements. When inception was given in the traditional way when the first trace of cavitation was observed, the inception curves of both propellers were exactly the same, although the cavitation inception of limited cavitation was very different. The cavitation at inner radii became often ragged near inception because of the remaining spot cavities at the trailing edge of the roughness. It seems that these small cavities originate at the edge of the glue, as sketched in the Region A in Fig.24. This is further enhanced when there is a ridge of roughness elements at the end of the glue, as in the Region B in the figure. In such a case there is still inception in regions where there should be no inception. This can be improved by removing the tape immediately after the glue has been applied. In that case the ridge, caused by the tape, is removed before the roughness is applied, preventing a situation as in the Region B. This also improves the situation as in the Region A. The effect of roughness size was reflected in a strong variability of the spot thickness near inception, as sketched in the Region C in the figure. The length of the spots is sill consistent, but the thickness varies. When the spots become very short (near inception) this leads to a later disappearance of the thick spots. At low tunnel pressures tiny cavitation on roughness elements could be observed on both sides of the foil in Region C. This may be improved by using smaller roughness elements.
Inception of sheet cavitation then appeared when a large number of very thin spots showed a consistent cavity contour just outside the roughness region, as sketched in the Region D. With this improved inception criterion, the inception measurements were carried out again in 2010 in uniform condition in the cavitation tunnel for the two designed propellers. The result is shown in Fig.25. It shows that the inception bucket of sheet cavitation of the new blade section propeller widens, both on the pressure side and on the suction side. The bucket is about 18% wider than the reference propeller when the cavitation numberwith n being the rotation rate of the propeller model) is equal to 0.21. Tip vortex cavitation inception at the pressure side is also improved on the new blade section propeller, while inception at the suction side remained the same. It is suspected that the new blade sections change the vortex flow along the leading edge at the outer radii, thus delaying inception of vortex cavitation.
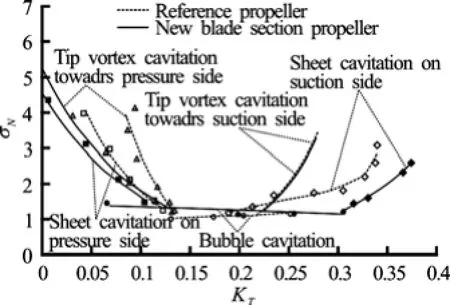
Fig.25 Comparison of cavitation buckets in uniform flows of the reference propeller and the new blade section propeller
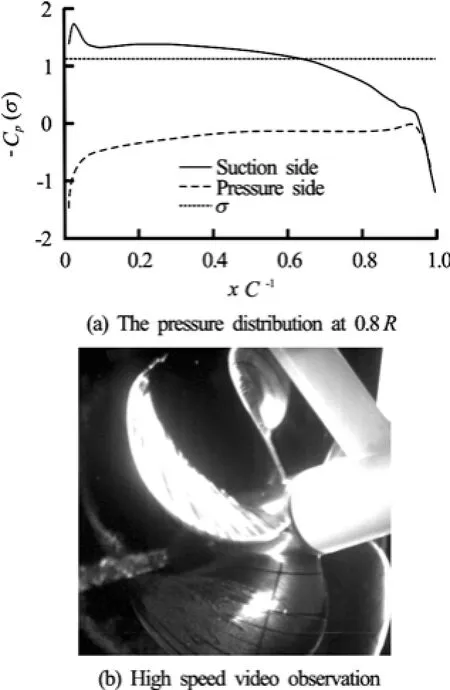
Fig.26(a) Comparison of the cavitation and the calculated pressure distribution on 0.8R section of the reference propeller
4.2 Cavitation configuration
When cavitation appears it reflects the calculated pressure distribution at a speed of 30 kn, as shown inFig.26. In this figure the pressure distribution at 0.8R is calculated by the unsteady panel code at a blade position of 54o. The photo shows the cavitation from high-speed video observations in corresponding conditions. For the reference propeller there is a calculated pressure peak near the leading edge and the pressure coefficient is lower than the vapor pressure up to 65 percent of the chord , which leads to extensive sheet cavitation, consistent with the picture. For the new propeller, the pressure is lower than vapor pressure from about 20 percent of the chord to 80 percent. This leads to bubble cavitation, as is also shown in the picture.
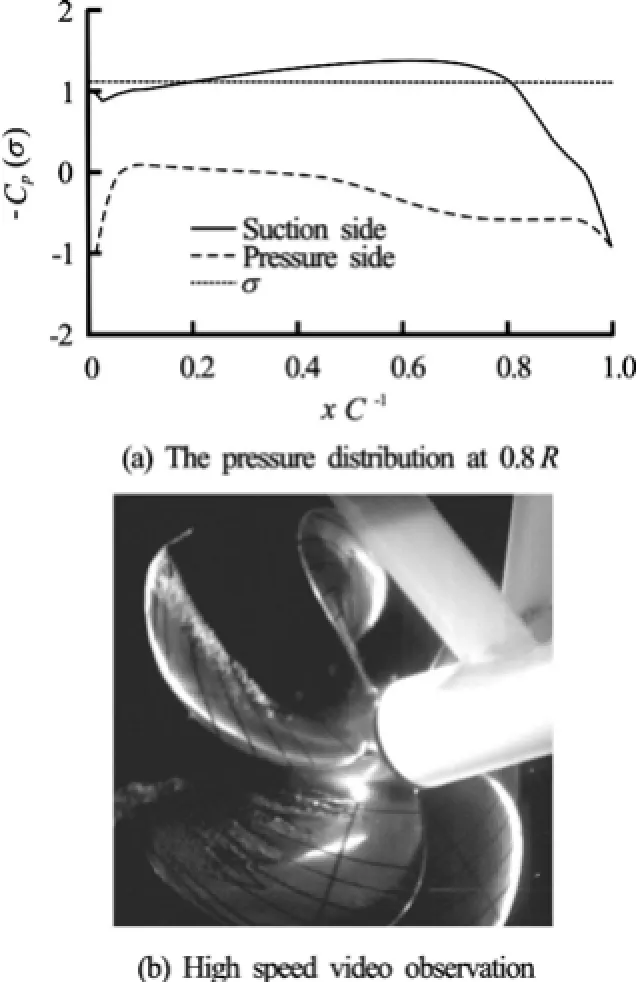
Fig.26(b) Comparison of the cavitation and the calculated pressure distribution on 0.8R section of the new propeller
The cavitation observation tests were carried out in the CLCC, with a model propeller of 0.25 m. The rotation rate in the design condition was 1 600 rpm, which leads to a sectional Reynolds number at 0.7R of 1.35×10⁶. Earlier tests at a Reynolds number of 9× 10⁵showed that the sheet cavitation at the reference propeller was very incidental. A sheet was formed at highly different blade positions which gave the observations with stroboscopic illumination a very flashy appearance. This is clearly due to scale effects on inception, which means that inception occurred at local pressures far below the equilibrium vapor pressure. These phenomena were also observed on the reference propeller in the present tests. Leading edge roughness has been applied on both the reference propeller and the new propeller to reduce these scale effects. Application of leading edge roughness in the CLCC was necessary up to unexpectedly high Reynolds numbers. It is suspected that the low nuclei content of the tunnel plays a significant role. It seems as if a minimum amount of nuclei is still necessary. These indications are also found in the Depressurised Towing Tank (DTT) at Maritime Research Institute Netherlands (MARIN) at Marin at lower Reynolds numbers.
The pressure distribution on the new propeller at inception is very flat on the suction side. As a result, the sheet cavity will be very long and extended cavitation will occur. When the propeller blade moves out of the wake peak the cavitation will become bubble cavitation. This was observed on the new propeller. The bubbly cavitation is quite thin and stable, without a cloudy implosion. It is therefore not expected to be erosive. Further investigations in the dynamics of very thin sheet/bubble cavities, of which the extent varies rapidly, are still necessary to assess the erosivity of this type of cavitation.
5. Conclusions
A design technique using new blade sections to optimize inception speed has been developed in CSSRC. The article shows the efficiency and convergence of the method. Preliminary data of a benchmark model and propeller are given. The following conclusions have been reached:
(1) An optimization technique has been developed, using a genetic algorithm to integrate the program of Eppler-Shen, which is more accessible and convenient, and can save a lot of time for designers.
(2) The alternative procedure for the effective blade section, using a lifting surface design method, makes the incorporation of two-dimensional sections into three-dimensional propeller blade sections efficient. This is especially the case when several different sections at different radii are optimized simultaneously.
(3) The configuration of model 5415 with the improved struts and with the reference propeller is very useful as a basis for the validation of calculations with a RANS code.
(4) Preliminary experimental results confirm that the inception behavior of the optimized propeller is significantly improved.
(5) The pressure distribution calculated by an unsteady panel code is consistent with the cavitation appearance from high-speed video observations, but the cavitation on a propeller with maximum inception speed is a very thin sheet with transition to bubble cavitation. Its properties have to be investigated further.
(6) Application of leading edge roughness is necessary on the optimized propeller, and also on the reference propeller, up to unexpectedly high Reynolds numbers. The role of nuclei has to be investigated further.
Acknowledgements
This work was carried out in CSSRC. The authors would like to thank the design group, the CFD group, the model manufacture group and the test group of the Center for their support. Sincere thanks are extended to Profs. Dong Shi-tang and Tang Deng-hai for their continuous guidence. The authors wish to express their gratitude to Prof. Zhou Wei-xin and Dr. Liu Xiao-long for their valuable discussions.
[1] KUIPER G., JESSUP S. D. A propeller design method for unsteady conditions[J]. SNAME Transactions, 1993, 101: 247-273.
[2] WANG Da-zheng, WANG Yan-ying. Study on a new apparoch to blade section design and effects of its parameters on cavitation characteristics-Part Ⅱ: Effects of blade section parameters on cavitation characteristics[J]. Journal of Hydrodynamics, Ser. A, 2000, 15(3): 320- 328(in Chinese).
[3] ZHOU Wei-xin. The design and calculation system of propellers for naval surface ships[D]. Ph. D. Thesis, Wuxi: China Ship Scientific Research Center, 2002(in Chinese).
[4] DANG J. Improving cavitation performance with new blade sections for marine propellers[J]. International Shipbuilding Progress, 2004, 51(4): 353-376.
[5] MAKIAKOV D. V., AVKHADIEV F. G. Design of cavitation-free hydrofoils by a given pressure envelope[C]. Proceedings of the 7th International Sympo- sium on Cavitation. Ann Arbor, Michigan, USA, 2009.
[6] XU Zu-xin, WEI Zhong and YIN Hai-long et al. Optimized design of natural ecological wastewater treatment system based on water environment model of dynamic mesh technique[J]. Journal of Hydrodynamics, 2010, 22(1): 1-8.
[7] XU Min, ZHANG Shi-lian. A numerical study on side hull optimization for trimaran[J]. Journal of Hydrodynamics, 2011, 23(2): 265-272.
[8] HSIN Ching-Yeh, WU Jia-Lin and CHANG Sheng-Fong. Design and optimization method for a twodimensional hydrofoil[J]. Journal of Hydrodynamics, Ser, B, 2006, 18(5 Suppl.): 323-329.
[9] BLACK S., SHEN Y. T. and JESSUP S. D. Advanced blade sections for high speed propellers[C]. Proceedings of Propellers and Shafting Symposium. Virginia, USA, 2006.
[10] BARRETT T. R., BRESSLOFF N. W. and KEANE A. J. Airfoil shape design and optimization using multifidelity analysis and embedded inverse design[J]. AIAA Journal, 2006, 44(9): 2051-2060.
[11] GANDHI F., FRECKER M. and NISSLY A. Design optimization of a controllable camber rotor airfoil[J]. AIAA Journal, 2008, 46(1): 142-153.
[12] QIAN Qin-jian, LIU Miao-qin and SUN Liang et al. The optimal motion of two-dimensional undulating plate swimming in fluid flow[J]. Journal of Hydrodynamics, 2011, 23(1): 12-20.
[13] STERN F., LONGO J. and PENNA R. et al. International collaboration on benchmark CFD validation data for surface combatant DTMB model 5415[C]. 23rd Symposium on Naval Hydrodynamics. Val de Reuil, France, 2000.
[14] BURG C., SREENIVAS K. and HYAMS D. et al. Unstructured nonlinear free surface simulations for the fully-appended DTMB Model 5415 series hull including rotating propulsors[C]. 24th Symposium on Naval Hydrodynamics. Fukuoka, Japan, 2002.
[15] GORSKI J. J., MILLER R. W. and COLEMAN R. M. An investigation of propeller inflow for naval surface combatants[C]. 25th Symposium on Naval Hydrodynamics. St. John’s, Canada, 2004.
[16] PATERSON E. G., WILSON R. V. and STERN F. General-purpose parallel unsteady RANS ship hydrodynamics code: CFDSHIP-IOWA[R]. IIHR Report, 2003, No. 432.
[17] EPPLER R., SHEN Y. T. Wing sections for hydrofiles, Part 1, Symmetric profiles[J]. Journal of Ship Research, 1979, 23(3): 209-217.
10.1016/S1001-6058(11)60220-5
* Biography: ZENG Zhi-bo (1980-), Male, Ph. D. Candidate, Engineer
2012,24(1):65-75
- 水動力學(xué)研究與進展 B輯的其它文章
- WALL EFFECTS ON FLOWS PAST TWO TANDEM CYLINDERS OF DIFFERENT DIAMETERS*
- A NOVEL DESIGN OF COMPOSITE WATER TURBINE USING CFD*
- THERMAL IMAGING STUDY OF SCALAR TRANSPORT IN SHALLOW WAKES*
- ANISOTROPIC PERMEABILITY EVOLUTION MODEL OF ROCK IN THE PROCESS OF DEFORMATION AND FAILURE*
- HIGH-SPEED FLOW EROSION ON A NEW ROLLER COMPACTED CONCRETE DAM DURING CONSTRUCTION*
- THE SLOP FLUX METHOD FOR NUMERICAL BALANCE IN USING ROE’S APPROXIMATE RIEMANN SOLVER*

