Satellite dataset analysis of recent vegetation variation in Tibet region
Zhuo Ga , Xin Li , Luo Bu , CaiYun Wang
1. Tibet Institute of Plateau Atmospheric and Environmental Science, Lhasa, Tibet 850000, China
2. Lhasa Branch of Institute of Plateau Meteorology, China Meteorological Administration, Lhasa, Tibet 850000, China
3. Climate Center of Ningxia Meteorological Bureau, Yinchuan 750002, China
Satellite dataset analysis of recent vegetation variation in Tibet region
Zhuo Ga1,2*, Xin Li3, Luo Bu1, CaiYun Wang1
1. Tibet Institute of Plateau Atmospheric and Environmental Science, Lhasa, Tibet 850000, China
2. Lhasa Branch of Institute of Plateau Meteorology, China Meteorological Administration, Lhasa, Tibet 850000, China
3. Climate Center of Ningxia Meteorological Bureau, Yinchuan 750002, China
This research investigates the recent distribution variation trends of vegetation in the Tibet region using Normalized Difference Vegetation Index (NDVI) data from 2000 to 2007. It also discusses the causes of vegetation degradation in typical regions (such as Nagqu) based on climatic conditions, human activity, and other influencing factors. Results show that the areas with the best vegetation cover are in Nyingchi and the southern part of Shannan, followed by Chamdo, the Lhasa area, and the eastern part of Nagqu. Vegetation in various regions exhibits significant seasonal differences. The vegetation status has improved in some parts of the Tibet region in the past few years, while the areas with the most serious degradation are in the middle and southern parts of the Nagqu region. On average, distinct vegetation degradation occurred between 2003 and 2006 in the whole Tibet region but vegetation has been increasing since 2006. The vegetation cover in summer basically determines the annual vegetation status. An increase in precipitation and decrease in wind speed generally corresponds to an increase in vegetation cover. The reverse is also true:a decrease in precipitation and increase in wind speed correspond to the decrease in vegetation cover. NDVI is thus positively related to temperature and precipitation but has a negative relation with wind speed. Increasing temperature and decreasing precipitation have led to the present vegetation degradation in Nagqu, and vegetation in all of these regions has been affected by growth of human population, intensified urbanization, livestock overgrazing leading to the proliferation of noxious plants, extraction of underground minerals and alluvial gold, extensive harvesting of traditional Chinese medicinal plants [e.g.,Cordyceps sinensis,Caladiumspp., and saffron crocus (Crocus sativus)], and serious rodent and other pest damage.
Tibet; vegetation degradation; remote sensing monitoring; NDVI
1. Introduction
The relationship between Earth’s vegetation and climate change is one of the main subjects in the study of global change (Melilloet al., 1993; Loehle and Leblanc, 1996;Zhenet al., 1997). As one of the main components in terrestrial ecosystems, the distribution of vegetation is strongly affected by the environment but, conversely, vegetation affects and changes the environment to some extent (Duet al.,2001). Now it is possible to monitor vegetation ecology in real time, continuously and accurately, using accumulated observation datasets from satellite remote sensing technology. NOAA satellite data have been used to analyze the vegetation status of regional areas (Sunet al., 2001; Zhanget al., 2001; Guoet al., 2002; Liet al., 2002; Yanet al., 2003;Li Zet al., 2005; Yang and Piao, 2006; Yuet al., 2006; Liu YQet al., 2007; Guanet al., 2008; Li HQet al., 2008), and also can reveal the activity of terrestrial vegetation in China(Li and Shi, 2000; Piao and Fang, 2001; Chenet al., 2002;Fanget al., 2003; Piao and Fang, 2003) as well as the Northern Hemisphere (Gonget al., 2002). Because Moderate Resolution Imaging Spectroradiometer (MODIS) remote sensing data have high resolution and its vegetation indexes include NDVI and an enhanced vegetation index (EVI),some researchers (e.g., Yanget al., 2007) have established estimation models of grass yield with EVI. Linet al. (2006),Zhuet al. (2007), and Liu AXet al. (2007) developed a desertification index using an inversion technique to monitor areas with serious desertification. Song and Ma (2007) dynamically monitored the status of vegetation cover in northwest China based on the Système Probatoire d'Observation de la Terre (SPOT) satellite datasets.
The Tibetan Plateau (hereafter called the Plateau), with its unique geographic location and ecological environment,has become one of the hot spots of worldwide ecology research (Liuet al., 1994; Luo, 1995; Gaoet al., 2003; Li DLet al., 2005; Zhouet al., 2005; Xu and Liu, 2009). If the ecological environment of the Plateau is destroyed, it might take hundreds of years to recover. Research by Yang and Piao (2006) demonstrated that vegetation has had an increasing trend over the Plateau in the past 20 years, and that an increase of temperature in spring results in an increase of NDVI while an increase of NDVI in summer is the result of the combined action between temperature in summer and precipitation in spring. Quite a few studies (Liu YQet al.,2007; Fanet al., 2008; Li HQet al., 2008; Li XMet al.,2008) have been conducted on the effects of vegetation in winter and spring on temperature and precipitation in summer over the Plateau.
Because Tibet comprises the main part of the Plateau and has a complicated underlying surface, the study of vegetation in this area has attracted more and more study.Researchers have pointed out that there is an increasing NDVI trend in most parts of the Tibet region, and the positive correlation between NDVI variation, precipitation, and temperature has evident regional characteristics (Chu, 2003;Maoet al., 2007; Zhuoet al., 2007; Yanget al., 2008).
In general, only a few works have focused on the vegetation conditions in Tibet, and those studies mainly used NOAA/AVHRR data and the research periods were basically limited to 1982 through 2001. Our study investigates the distribution and variation of vegetation in a recent eight-year period (2000-2007) in the Tibet region, and their possible causes. This study will benefit the development of local animal husbandry in a manner that protects the Plateau ecological environment and its biological diversity and achieves sustainable utilization of grassland resources.
2. Data sources and methods
A satellite-derived vegetation index provides vegetation information through the combination of infrared and near-infrared wave ranges based on the strong absorption of vegetation chlorophyll at 0.69 μm. Since NDVI can accurately reflect vegetation parameters such as vegetation cover, biomass, absorptive photosynthetically active radiation (PAR), and evaporation rate (Tuckeret al., 1986; De-Frieset al., 1995; Sellerset al., 1995), it is widely used to assess the interaction between vegetation variation and climate change at global and regional scales. The NDVI data used in this study were obtained from the Land Process Distributed Active Archive Center (LP DAAC,https://lpdaac.usgs.gov/main.asp), which is derived from 1-km MODIS data. The data are available for every month from January 2000 through February 2008. The meteorological variables used here include precipitation, mean air temperature, and wind speed on a monthly time scale at eight stations (Bange, Anduo, Nagqu, Shenza, Suoxian, Biru,Jiali, Dangxiong) in the Nagqu region during the same time period as the satellite dataset.
The composition and reprojection of NDVI are realized by the Environment for Visualizing Images (ENVI) and MODIS Reprojection Tool (MRT), which are provided by LP DAAC. First we matched the downloaded data based on the range of the Tibet region and reprojected the images to standard latitude/longitude coordinates, and then saved the MODIS data in GEOTIF format. Then we overlaid the county boundaries and the calculated annual and seasonal data in ENVI. Finally, we redeposited the data in ASCII format for correlation calculation between the vegetation index and meteorological factors. Also, we analyzed the seasonal distribution of vegetation according to different seasons (March to May indicating spring, June to August indicating summer, September to November indicating autumn, and December to February of the next year indicating winter).
3. Distribution and interannual variation of vegetation
3.1. Distribution of annual and seasonal mean NDVI
The spatial distribution of annual mean NDVI(2000-2007, Figure 1a) demonstrates that vegetation is quite sparse in most parts of the Tibet region, especially in Ngari,in most parts of Nagqu, and in Shigatse where the NDVI is almost <0.2 and are considered desert and rock areas. The NDVI in the eastern parts of Nagqu, Lhasa, and Chamdo and the northern part of Shigatse ranges from 0.2 to 0.4.Besides, the NDVI and in the eastern part of Chamdo and the southern part of Shigatse is >0.4. The areas with best NDVI are in Nyingchi and the southern part of Shannan,>0.6.
The seasonal distribution of NDVI has basically similar spatial pattern as annual distribution. Since NDVI values in spring and autumn are distributed similarly to those in winter and summer, respectively, here we therefore only discuss the spatial distribution of summer and winter (Figure 1b,Figure 1c). Comparing the annual distribution of vegetation,the range expanded where NDVI is >0.2 in summer, and NDVI can reach 0.4 in most parts of Chamdo. However, the NDVI in winter is <0.2 in Nagqu, Shigatse, and the northern part of Shannan. In general, vegetation exhibited remarkable seasonal differences in various areas. For instance, the seasonal variation in the middle and eastern parts of Nagqu,Shigatse, and Chamdo is greater than the variation in Ngari and Nyingchi, which is closely related to the local climate conditions and vegetation types.
To better understand the spatial distribution of vegetation in the Tibet region, we calculated the cross section of annual distribution of vegetation (Figure 2) along three latitudes(29°N, 31°N, 33°N) and three longitudes (83°E, 88°E, 93°E).The cross section along latitudes (Figure 2a) shows that the vegetation status in the eastern and southern areas is much better than in the western and northern areas. The cross section along longitudes (Figure 2b) and the seasonal distribution reflect the same characteristics.
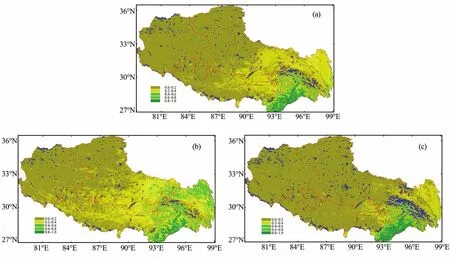
Figure 1 Distribution of multi-year mean NDVI in the Tibet region. (a) Annual mean, (b) summer mean, (c) winter mean. Red line indicates the boundaries of seven different districts in the Tibet region.
3.2. Distribution of multi-year maximum composite NDVI
Since the annual maximum NDVI can reflect the vegetation cover for the season with the best growth trend, we calculated multi-year maximum NDVIs to analyze the spatial distribution of vegetation from January 2000 through February 2008. The results (Figure 3a) show that the best vegetation cover is in Nyingchi and in the southern part of Shannan, where the NDVI can reach well over 0.8, followed by Chamdo, Lhasa, and the eastern part of Nagqu, where the NDVI is >0.6; in some areas, such as the eastern part of Shigatse, the NDVI ranges from 0.4 to 0.6. The vegetation in other places is quite sparse (NDVI ≤0.4), especially in Ngari, most parts of Nagqu, and Shigatse.
The seasonal distribution of NDVI (Figures 3b, c) indicates that in summer it has spatial characteristics very similar to the annual NDVI. The difference is that the area range having higher NDVIs (about 0.2 to 0.4) expands during summer. In the winter the NDVI in other areas clearly decreases, except for Nyingchi and the southern part of Shannan where the NDVI is about 0.6 to 0.8. Thus, in general the maximum composite NDVI has obvious seasonal differences as well as similarities in the distribution of annual and seasonal mean NDVIs in various areas.
3.3. Spatial difference of annual maximum composite NDVI
To better understand the variation of vegetation cover in the 2000-2007 study period in the Tibet region, we calculated the differences in annual maximum composite NDVI(Figure 4a), and the maximum composite NDVI in summer(Figure 4b) and in winter (Figure 4c), as well between two representative years (2000 and 2007) to represent the variation of vegetation in recent years. The vegetation in some areas has improved in the past few years, especially in the southeast part of Nyingchi and the northwest part of Nagqu,and this aspect is quite evident in summer. There is an increasing trend in winter in Shigatse, Ngari, and Chamdo,and the most serious degradation areas are in the middle and eastern parts of Nagqu; this aspect is more evident in summer than in winter. We hypothesize that the increase of vegetation in the northwest part of the Tibet region is related to climate conditions as well as the fact that most of this area is thinly populated.
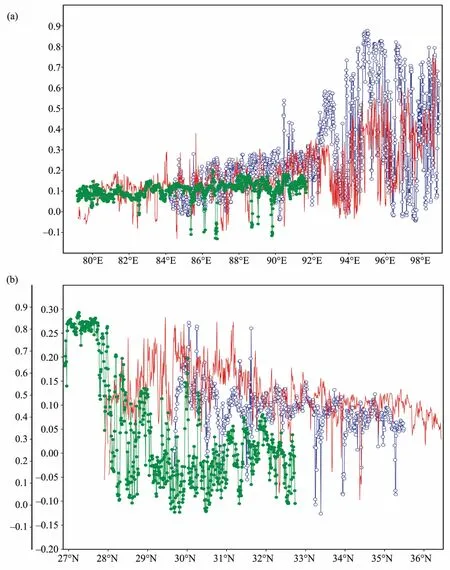
Figure 2 Cross-section of multi-year mean NDVI along different latitudes and longitudes in the Tibet region. (a) Cross section along the latitudes, (b) cross section along the longitudes. Empty circles, solid lines, and solid circles indicate the cross sections along 29°N, 31°N,33°N and 83°E, 88°E, 93°E, respectively. Here we use sub-coordinate indicating vertical axis for solid circle line in Figure 2b.
3.4. Interannual variation of annual maximum composite NDVI
To further understand the interannual variation of vegetation cover in recent years, we calculated the annual and seasonal difference of multi-year maximum composite NDVIs between adjacent years (Figure 5). Results show that in 2001, 2003, and 2007 the vegetation cover was higher than in the immediately preceding years, but in other years was lower than in the immediately preceding years. Considering different seasons, in the spring of 2002, 2004, and 2006 the cover was higher than in the immediately preceding years, and in autumn and winter in 2001, 2003, 2005,and 2007 the cover was higher than in the immediately preceding years. In general, the variation trend of maximum composite NDVI in summer, autumn, and winter was similar to the annual maximum composite NDVI (except for 2005 minus 2004), while the NDVI of spring had an almost opposite variation (except for 2005 minus 2004, and 2007 minus 2006). On average, the period between 2003 and 2006 had the most distinct vegetation degradation, but the vegetation began to increase since 2006. The vegetation cover in summer basically determines the annual vegetation status.
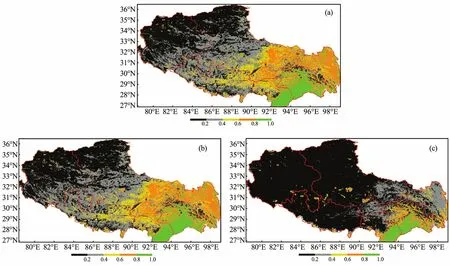
Figure 3 Spatial distribution of multi-year maximum composite NDVI in the Tibet region. (a) Maximum NDVI of annual mean,(b) maximum NDVI of summer, (c) maximum NDVI of winter. Red line indicates the boundaries of seven different districts in the Tibet region.
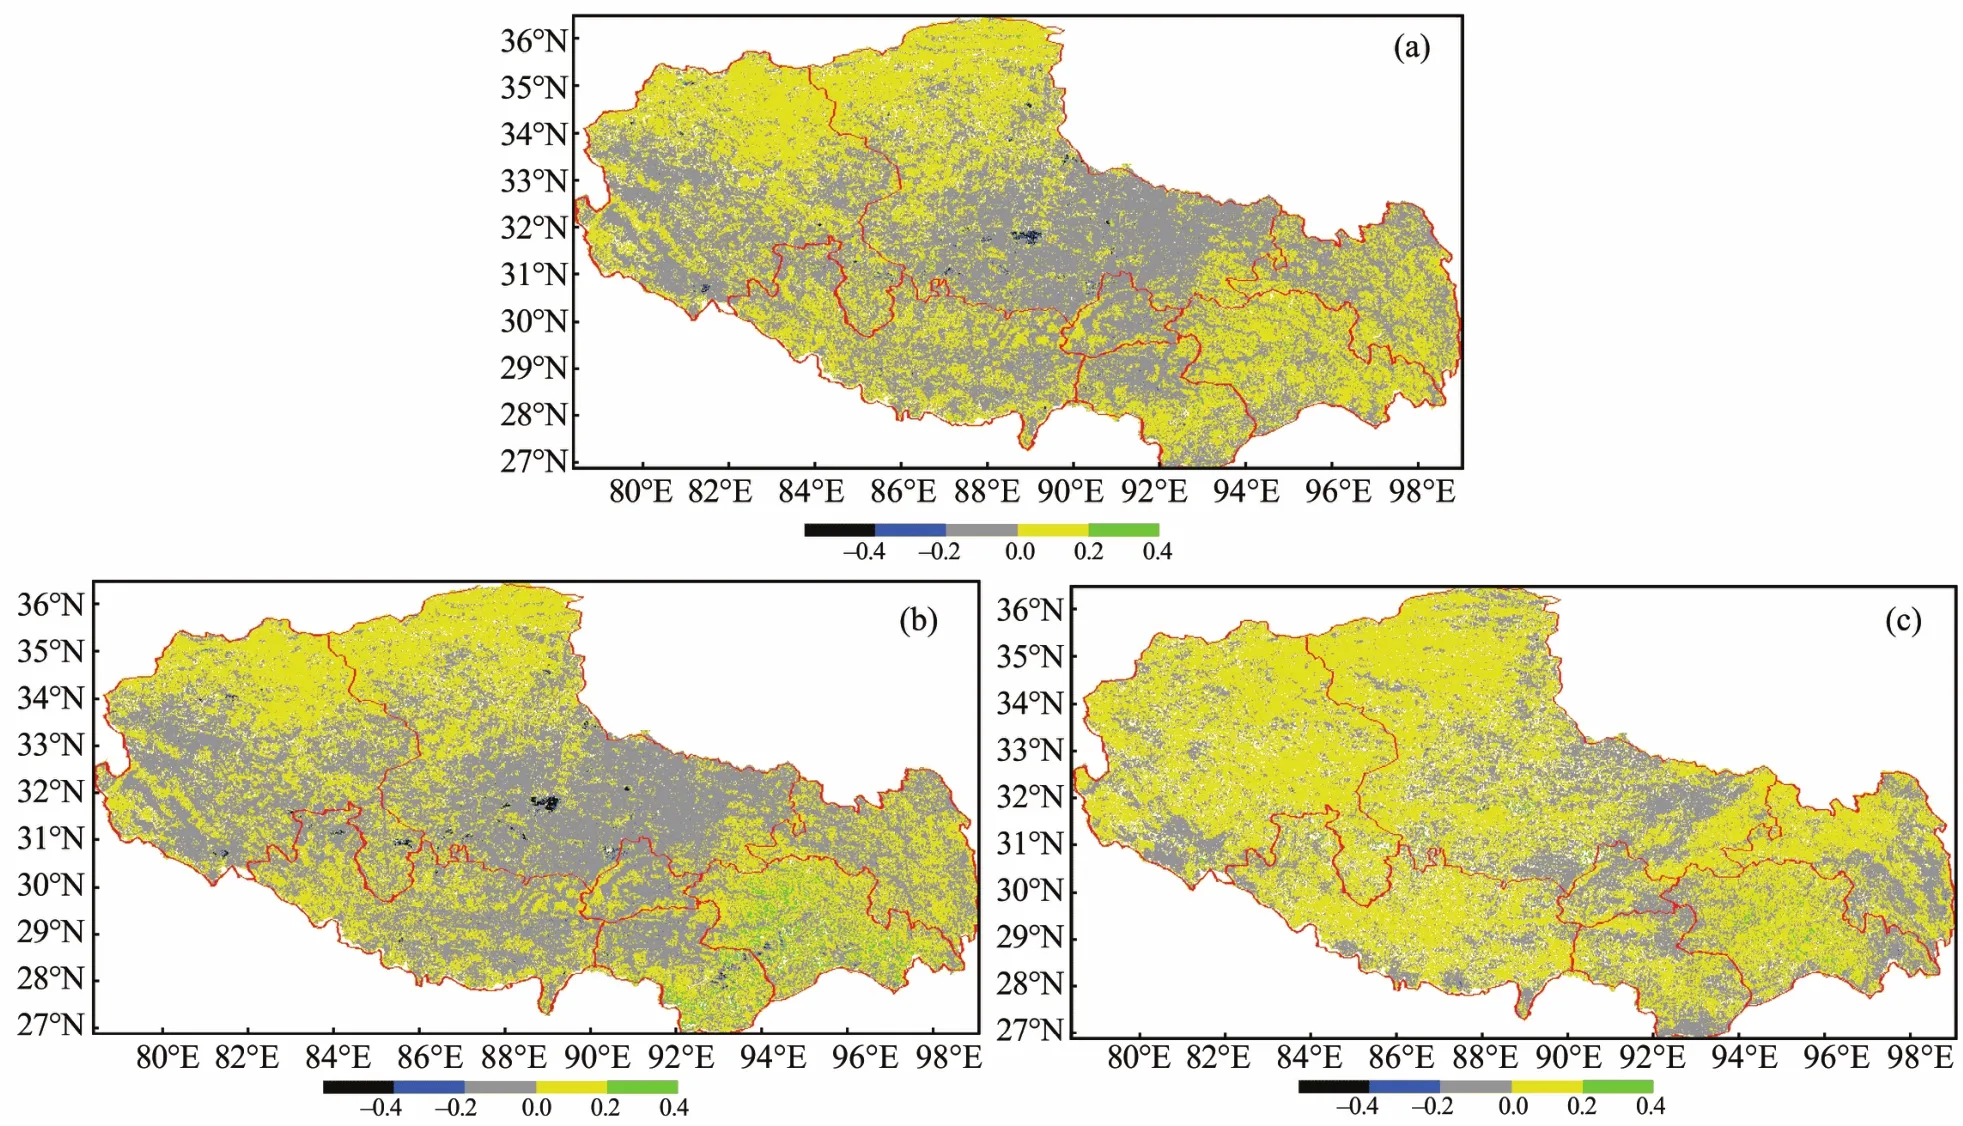
Figure 4 Spatial difference of maximum composite NDVI in the Tibet region (2007 minus 2000). (a) Annual mean variation,(b) summer variation, (c) winter variation. Red line indicates the boundaries of seven different districts in the Tibet region.
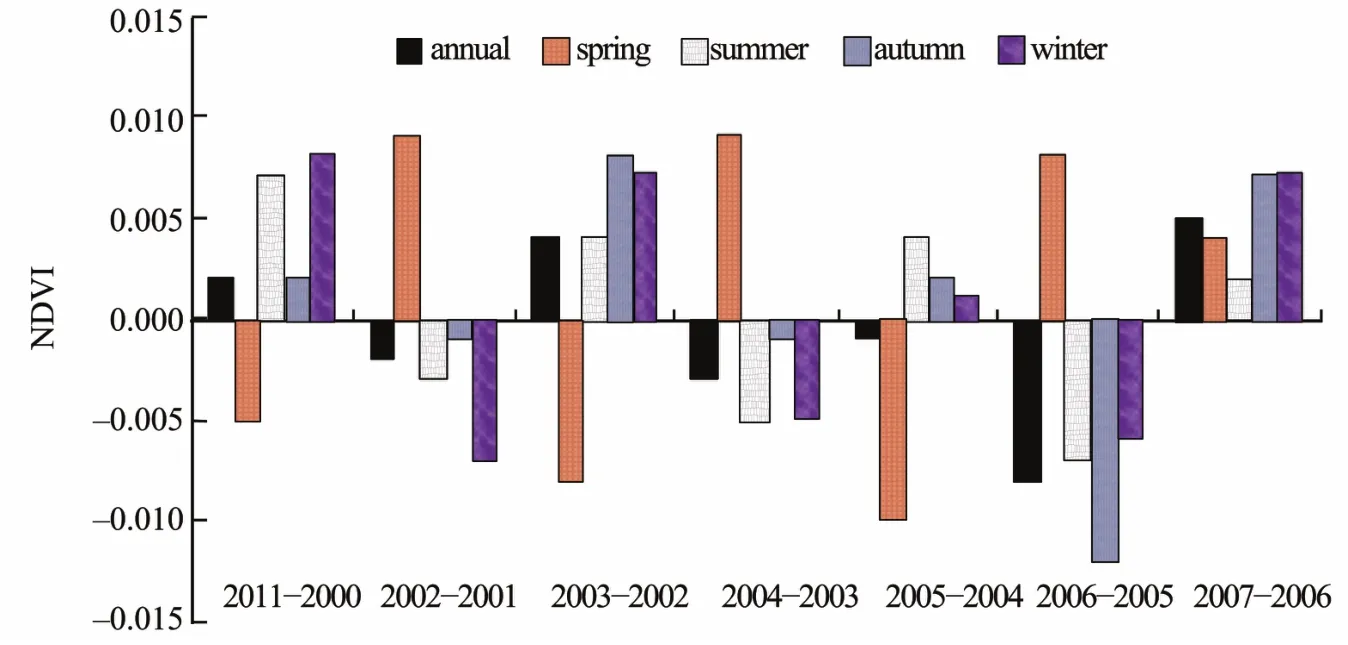
Figure 5 Interannual change of multi-year maximum composite NDVI in the Tibet region from 2000 to 2007.
4. Reasons for grassland degradation in the Nagqu region
Based on the analysis in Section 3.3, vegetation degradation is quite serious in the middle and eastern parts of the Nagqu region. Animal husbandry, especially livestock grazing,is a major industry for the local population and economy(Yang, 2003). Earlier research (Wanget al., 2004) described the sustainability problems faced by this animal husbandry-based economy, including natural and manmade factors. The Plateau climate exhibits warming and drying trends under the influence of global warming, and the alpine vegetation zone is expanding southward, which represents an increasingly arid climate system leading to the decrease of vegetation biomass and grassland loading capacity (Liet al.,1999). Climate change has accelerated soil erosion, desertification, and losses of soil nutrients and water. The loss of nitrogen, phosphorous, and potassium causes the decrease of soil organic matter and lessens soil productivity, grass quality, and livestock carrying capacity, which seriously jeopardizes animal husbandry in this region (Chenet al., 2005).
4.1. Climate conditions
Climate conditions directly determine the distribution and variation of vegetation, but in a feedback loop mechanism the vegetation itself can either slow down or intensify the range of climate change to some extent. Research by Xuet al. (2008) shows that the difference of temperature determines the difference of regional vegetation cover, but that precipitation is the major climate driving force that determines the interannual variation and fluctuation of general vegetation cover over the Tibetan Plateau.
In Figure 6a the curve represents the interannual variation of meteorological factors and vegetation index on a multi-year averaged scale in typical regions. It demonstrates that NDVI increases from May and reaches its maximum in August, and it decreases from September onward; this NDVI pattern evidences the short vegetation growing season in the Nagqu region. Temperature and precipitation have similar variation as NDVI but they increase from April and reach their maximums in July and August, respectively.Wind speed achieves its maximum value in February and decreases from April until September, when it begins to increase again. Thus it can be seen that NDVI is positively related to temperature and precipitation but has a negative relation with wind speed.
Our earlier research (Zhuoet al., 2007) demonstrated that NDVI is positively related to precipitation, mean air temperature, and land surface temperature, and that precipitation during the non-flood season (from January to May)has an important contribution to vegetation growth. In addition, the relations between vegetation types and meteorological factors have evident regional characteristics. Vegetation is usually positively related to precipitation and air mean temperature in regions where grass is the main vegetation type.
The effect of annual variation of meteorological factors on vegetation cover (Figure 6b) in the Nagqu region is not so evident in the eight-year study period. In 2002, 2003, and 2007 the vegetation cover was higher than in the immediately preceding years, but the opposite was true in the other years. Precipitation had an increasing trend while temperature and wind speed had decreasing trends in general.
To sum up, the trend of increasing temperature and decreasing precipitation might lead to the decrease of vegetation cover, but there is a contrary phenomenon that temperature is sometimes negatively related to vegetation cover;this means that in some years an increase of temperature within a certain range (<1.5 °C) benefits the growth of vegetation, but if it exceeds that range it might restrain vegetation growth. Research by Xuet al. (2003) revealed that the response of vegetation growth to precipitation and temperature has seasonal and spatial differences, and that vegetation is quite sensitive to precipitation in drought areas and is negatively related to temperature. But for those areas with plentiful precipitation, this effect on vegetation is much weaker and temperature becomes the main factor affecting vegetation growth.
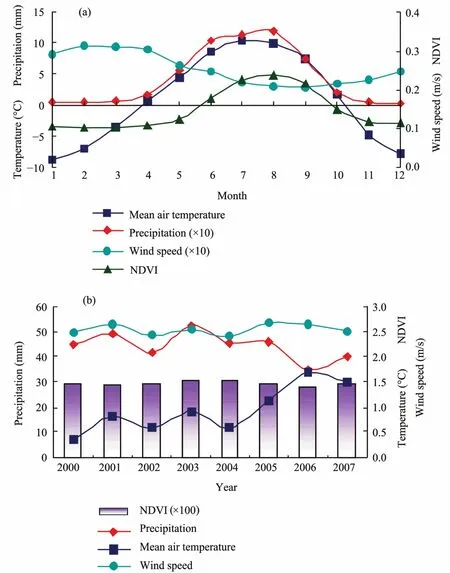
Figure 6 (a) Monthly variation of NDVI and meteorological factors in the Nagqu region, and (b) interannual change of regional averaged NDVI and meteorological factors in the Nagqu region.
4.2. Human activity
Increasing population and intensified urbanization are major anthropogenic factors that affect vegetation change in the Nagqu region. For instance, the total number of permanent residents in the whole Nagqu region was 265,800 in 1985; this increased to 362,800 in 2000 and to 405,300 in 2006. To understand the influence of human activity and other factors on vegetation, we carried out field investigations in the Nagqu region based on topography of sampling sites, GPS location, vegetation cover,terrestrial biomass of grassland, moisture content of grass and soil, degradation degree of grass, and rodent damage during the growing season in 2007. These field investigations indicate that the construction of economical housing improved the farmers’ lives and broadened the land utilization, which ironically contributed to more vegetation degradation. Because there are only a few permanent roads in the Nagqu counties, increased vacation camping in summer and off-road running of cars and motorcycles have seriously impaired local grasslands (Figure 7a). In addition,since the Nagqu region lacks electricity resources and infrastructure, the utilization of renewable resources such as solar and wind energy can relieve environmental pressure to some extent. The extensive use of ox dung for heating fuel in herdsmen’s daily life definitely lowers the soil fertility and the loose earth is becoming ever more barren.The desire for highly marketable fattened livestock has led to extensive overgrazing (Figure 7b). This seriously hinders the growth of grasses and accumulation of organic matter; the overloading rate can reach 141.84% (even 239.4% in the cold season) (Liet al., 2001).
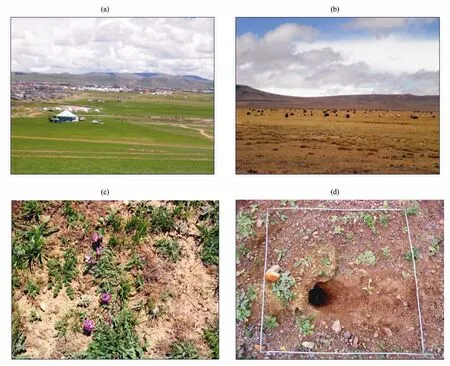
Figure 7 Anthropogenic and natural factors of vegetation degradation in the Nagqu region. (a) Urbanization and off-road vehicle impacts,(b) extensive overgrazing of livestock, (c) increased prevalence of noxious plants (such as Oxytropis coerulea),(d) increasingly serious rodent damage.
4.3. Other influencing factors
Beneficial grasses are more vulnerable than other grasses to harm by livestock overgrazing; in this scenario noxious plants (e.g., invasive non-palatable weeds) proliferate quickly, which then further restrains the growth of the desirable forage (Figure 7c). In addition, a great number of plants important in traditional Chinese medicine, such asCordyceps sinensis,Caladiumspp., and saffron crocus(Crocus sativus) are harvested in the Nagqu area. Digging their deep roots definitely destroys grassland and forms many deep hollows and loose earth, which produce substantial sand sources. Nagqu is also rich in underground minerals and alluvial gold resources; their exploitation seriously damages grasslands and the ecological environment for the financial revenue of local government. Still another factor is increasing rodent and insect pest activity (Figure 7d), which leads to great vegetation damage. All of these factors contribute to grassland degradation and result in the conflict between resource utilization and environmental sustainability (Mansueret al., 2002).
5. Conclusions
Utilizing satellite NDVI datasets, conventional meteorological observations, and social statistical data, this study investigates recent distribution and variation trends of vegetation in the Tibet region. Our conclusions are as follows:
(1) Multi-year averaged and maximum composite NDVI values demonstrate that the best vegetation cover is found in Nyingchi and the southern part of Shannan, followed by Chamdo, the Lhasa area, and the eastern part of Nagqu.Vegetation in various regions has significant seasonal differences. For instance, the seasonal variation in the middle and eastern parts of Nagqu, Shigatse, and Chamdo is greater than that in Ngari and Nyingchi, which is closely related to the different climate conditions and vegetation types.Cross-sectional analysis along latitudes and longitudes demonstrates that the vegetation status in the eastern and southern areas is much better than in the western and northern areas.
(2) The vegetation status has improved in some parts of the Tibet region in recent years, especially in the southeast part of Nyingchi and the northwest part of Nagqu. The areas with the most serious degradation are in the middle and southern parts of the Nagqu region. The relatively good vegetation status in the northwest area is related to favorable climate conditions and the fact that most of this area is sparsely populated. The most distinct vegetation degradation occurred between 2003 and 2006, on average,but the vegetation has been increasing since 2006. The vegetation cover in summer basically determines the annual vegetation status.
(3) An increase in precipitation and decrease in wind speed generally corresponds to an increase in vegetation cover. The reverse is also true: a decrease in precipitation and increase in wind speed corresponds to the decrease in vegetation cover. The relation of NDVI and meteorological factors has obvious regional characteristics for different vegetation types. Increasing temperature and decreasing precipitation have contributed to the current significant vegetation degradation in the Nagqu region, which has also been exacerbated by increased human population, intensified urbanization, livestock overgrazing leading to the proliferation of noxious plants, extensive harvesting of traditional Chinese medicinal plants, exploitation of underground minerals and gold resources, and serious rodent and insect pest damage.
The authors would like to thank the Land Process Distributed Active Archive Center (LP DAAC) and the Information Center of the Tibet Meteorological Bureau for providing the data used in this study. The authors also would like to express thanks to Professor JiaHua Zhang for his suggestions.We are also grateful to anonymous reviewer, whose insightful comments and constructive criticism have improved the paper substantially. This work was jointly supported by programs of the National Natural Science Foundation of China(No. 40665003) and the Institute of Plateau Meteorology(No. BROP200705).
Chen BM, Liu DC, Sui FX, 2005. Effects and countermeasures of water loss on animal husbandry. Heilongjiang Science and Technology of Water Conservancy, 33(5): 1-3.
Chen YH, Li XB, Chen J, 2002. The change of NDVI time series based on change vector analysis in China, 1983-1992. Journal of Remote Sensing,6(1): 12-18.
Chu D, 2003. Seasonal changes of vegetation cover in Lhasa area based on NOAA AVHRR NDVI. Plateau Meteorology, 22(supp.): 145-151.
DeFries R, Field C, Fung I, Justice CO, Los S, Matson PA, Matthews E,Mooney HA, Potter CS, Prentice K, Sellers PJ, Townshend JR, Tucker CJ, Ustin SL, Vitousek PM, 1995. Mapping the land-surface for global atmosphere-biosphere models, toward continuous distributions of vegetations functional properties. Journal of Geophysical Research, 100:20867-20882.
Du JW, Liang SJ, Hu CJ, Lu YP, 2001. The modeling development of the influence of surface plant cover changes on regional climate. Journal of Northwest Forestry University, 16(2): 22-27.
Fan GZ, Hua W, Huang XL, Wang YL, Liu YQ, Li XM, Li HQ, 2008.Advances of the study on influence of vegetation change over Tibetan Plateau on regional climate. Plateau and Mountain Meteorology Research, 28(1): 72-80.
Fang JY, Piao SL, He JS, Ma WH, 2003. The strength of vegetation activity in an recent twenty-year period in China. Science in China (Series C),33(6): 554-567.
Gao R, Wei ZG, Dong WJ, Wang CH, Zhong HL, 2003. Variation of the snow and frozen soil over Qinghai-Xizang Plateau in the late twentieth century and their relations to climatic change. Plateau Meteorology,22(2): 191-196.
Gong DY, Shi PJ, He XZ, 2002. Spatial features of the coupling between spring NDVI and temperature over Northern Hemisphere. Acta Geographica Sinica, 57(5): 505-514.
Guan XD, Guo N, Huang JP, Ge JM, Zhen ZH, 2008. Applicability analysis of VCI to monitoring northwest China drought. Plateau Meteorology,27(5): 1046-1053.
Guo N, Yang LF, Wang JL, 2002. A study of ecological environment in Heihe Valley area through meteorology satellite monitoring. Plateau Meteorology, 21(3): 267-273.
Loehle C, Leblanc D, 1996. Model-based assessments of climate change effects on forest: A critical review. Ecological Modeling, 90: 1-31.
Li DL, Zhong HL, Wu QB, Zhang YJ, Hou YL, Tang MC, 2005. Analyses on changes of surface temperature over Qinghai-Xizang Plateau. Plateau Meteorology, 24(3): 291-298.
Li HQ, Fan GZ, Zhou DW, Hua W, Liu YQ, Li XM, 2008. Character of spring vegetation change in the Qinghai-Tibet Plateau and its influence on summer air temperature. Scientia Geographica Sinica, 28(2):259-265.
Li L, Zhang GS, Shi XH, Wang QC, Xu WX, Dong LX, 1999. Effects and defense countermeasures of drought on water resources and farming industry. QingHai’s Science and Technology, 6(4): 21-23.
Li S, Dong YX, Dong GR, 2001. Problems of Desertification and Sustainable Development over Tibetan Plateau. Chinese Tibetology Press, Beijing. 142.
Li XB, Chen YH, Zhang YX, Fan YD, Zhou T, Xie F, 2002. Impact of climate change on desert steppe in northern China. Advance in Earth Sciences, 17(2): 254-261.
Li XB, Shi PJ, 2000. The sensitive analysis between NDVI of typical vegetation types and the variation of temperature, precipitation in China. Acta Phytoecologica Sinica, 24(3): 379-382.
Li XM, Zhou DW, Fan GZ, Li HQ, Hua W, Liu YQ, 2008. The lag relationship between winter NDVI over Tibetan Plateau and temperature of southwest China. Journal of Applied Meteorological Science, 19(2):161-170.
Li Z, Yan FL, Fan XT, 2005. The variability of NDVI over northwest China and its relation to temperature and precipitation. Journal of Remote Sensing, 9(3): 308-313.
Lin NF, Tang J, Si A, Li ZY, Wang XG, 2006. Study on desertification of Songnen Plain by EOS-MODIS data. Quaternary Sciences, 26(2):265-273.
Liu AX, Wang CY, Wang J, Shao XM, 2007. Monitoring approach of desertification with MODIS and NOAA/AVHRR data. Transactions of the Chinese Society of Agricultural Engineering, 23(10): 145-150.
Liu XD, Tian L, Wei ZG, 1994. Numerical experiments of influences of surface albedo in Qinghai-Xizang Plateau on East Asia summer monsoon. Plateau Meteorology, 13(4): 468-472.
Liu YQ, Fan GZ, Zhou DW, Li HQ, Hua W, Li XM, 2007. Variability of NDVI in winter and spring on the Tibetan Plateau and their relationship with summer precipitation. Acta Meteorologica Sinica, 65(6): 959-967.
Luo Y, 1995. Studies on the effect of snow cover over the Qinghai-Xizang Plateau in winter and spring on general circulation over East Asia in summer. Plateau Meteorology, 14(4): 505-512.
Mansuer S, Abulajiang S, Zhou JJ, 2002. The sustainable development of grassland resources and livestock husbandry of Xinjiang. Pratacultural Science, 19(4): 11-15.
Mao F, Lu ZG, Zhang JH, Hou YL, 2007. Relations between AVHRR NDVI and climate factors in northern Tibet in recent 20 years. Acta Ecologica Sinica, 27(8): 3198-3205.
Melillo JM, Kicklighter DW, McGuire AD, Kicklighter DW, 1993. Global climate change and terrestrial net primary production. Nature, 363:234-240.
Piao SL, Fang JY, 2001. Dynamic vegetation cover change over the last 18 years in China. Quaternary Sciences, 21(4): 294-302.
Piao SL, Fang JY, 2003. Seasonal changes in vegetation activity in response to climate changes in China between 1982 and 1999. Acta Geographica Sinica, 58(1): 119-125.
Sellers PJ, Meeson BW, Hall FG, Asrar G, Murphy RE, Schiffer RA, Bretherton FP, Dickinson RE, Ellingson RG, Field CB, Huemmrich KF, Justice CO, Melack JM, Roulet NT, Schimel DS, Try PD, 1995.Remote sensing of the land surface for studies of global change: Models-algorithms-experiments. Remote Sensing of Environment, 51: 3-26.
Song Y, Ma MG, 2007. Study on the vegetation cover change in northwest China based on SPOT vegetation data. Journal of Desert Research, 27(1):89-93.
Sun R, Liu CM, Zhu QJ, 2001. Relationship between the fractional vegetation cover change and rainfall in the Yellow River Basin. Acta Geographica Sinica, 56(6): 667-672.
Tucker CJ, Fung IY, Keeling CD, Gammon RH, 1986. Relationship between atmospheric CO2variations and a satellite-derived vegetation index. Nature, 319: 195-199.
Wang M, Li Y, Pan S, Bai XZ, Huang RQ, 2004. Influences of climate change on sustainable development of the hinterland of Qinghai-Tibet Plateau. China Population Resources and Environment, 14(3): 92-95.
Xu WX, Liu XD, 2009. Regional pattern of vegetation responses to global warming in the Qinghai-Tibet Plateau during late spring and early summer. Plateau Meteorology, 28(4): 723-730.
Xu XK, Chen H, Levy JK, 2008. Analysis of temporal and spatial distribution of vegetation over Tibetan Plateau and its origin under global warming. Chinese Science Bulletin, 53(4): 456-462.
Xu XK, Lin ZH, Xue F, Zeng QC, 2003. Correlation analysis between meteorological factors and the ratio of vegetation cover. Acta Ecologica Sinica, 23(2): 221-230.
Yan FL, Li Z, Shao Y, Lu HX, Fan XT, Ren X, 2003. Monitoring of vegetation cover in west area with NOAA/AVHRR data. Journal of Lanzhou University (Natural Science), 39(2): 90-94.
Yang RR, 2003. Grassland ecological environment safety and sustainable development problems in the Tibet Autonomous Region. Acta Prataculturae Sinica, 12(6): 24-29.
Yang XH, Zaxi Yangzong, Zhuo Ga, BianBa CiRen, 2008. Relation of vegetation coverage to meteorological conditions in the Nagqu area in Tibet. Acta Prataculturae Sinica, 17(2): 102-109.
Yang YH, Piao SL, 2006. Variations in grassland vegetation cover in relation to climatic factors on the Tibetan Plateau. Journal of Plant Ecology,30(1): 1-8.
Yang YL, Qiu XF, Yin QJ, 2007. Study on monitoring system of Qinghai Grassland output based on MODIS EVI data. Meteorological Monthly,33(6): 102-106.
Yu XF, Sun R, Chen YJ, Liu SM, Zhou HZ, Zhang ZS, 2006. Dynamics of vegetation cover and its relationship with rainfall in Wushen County of Inner Mongolia. Resources Science, 28(4): 31-37.
Zhang J, Ge JP, Guo QX, 2001. The relation between the change of NDVI of the main vegetational types and the climatic factors in the northeast of China. Acta Ecologica Sinica, 21(4): 522-527.
Zhen YR, Zhou GS, Zhang XS, Yang DA, Xia L, 1997. Sensitive study on the effect of land ecosystem on global change. Acta Botanica Sinica,39(9): 837-840.
Zhou NF, Qin NS, Tu QP, Li DL, 2005. Analyses on regional characteristics of temperature changes over Qinghai-Xizang Plateau in recent 50 years.Plateau Meteorology, 24(3): 344-349.
Zhu YX, Qin ZH, Xu B, 2007. Annual dynamic variation of grassland desertification based on MODIS data: An example from Inner Mongolia.Chinese Journal of Grassland, 29(4): 2-8.
Zhuo Ga, AWang Nima, Yang XH, 2007. Relation analysis between vegetation cover and meteorological factors over Tibet area. Scientia Meteorologica Sinica, 27(5): 488-494.
10.3724/SP.J.1226.2011.00426
*Correspondence to: Dr. Zhuo Ga, Research Fellow of the Tibet Institute of Plateau Atmospheric and Environmental Science, Tibet Meteorological Bureau. No. 2, North Linkuo Road, Lhasa, Tibet 850000, China. Tel: +86-891-6336344;Email: zhuoga2000@yahoo.com.cn
24 January 2011 Accepted: 14 May 2011
 Sciences in Cold and Arid Regions2011年5期
- Sciences in Cold and Arid Regions的其它文章
- Research progress in cold region wetlands, China
- Relationship analysis between September precipitation in western China and 700 hPa wind field in East Asia
- Characterization and quantification of within-year variation of snow-cover elevation in mountainous regions, eastern Tibet
- Influence of air masses on particle number concentration and size distribution at Mt. Waliguan, Qinghai Province, China
- Cenozoic Ephedraceae adaptation to global cooling in northwestern China
- Environmental records of snow pits in Yuzhufeng Glacier and Xiao Dongkemadi Glacier in the Tibetan Plateau
